Sentinel-5P TROPOMI keeping an eye on our air quality
Air pollution has been a world-wide health problem for more than a century and is a real threat to public health. One of the pollutants causing these health problems is nitrogen dioxide (NO2). According to the European Environment Agency (EEA) 2019 report, air pollution yearly causes about 400,000 premature deaths in Europe and induces enhanced risks on respiratory problems and heart and vascular diseases.
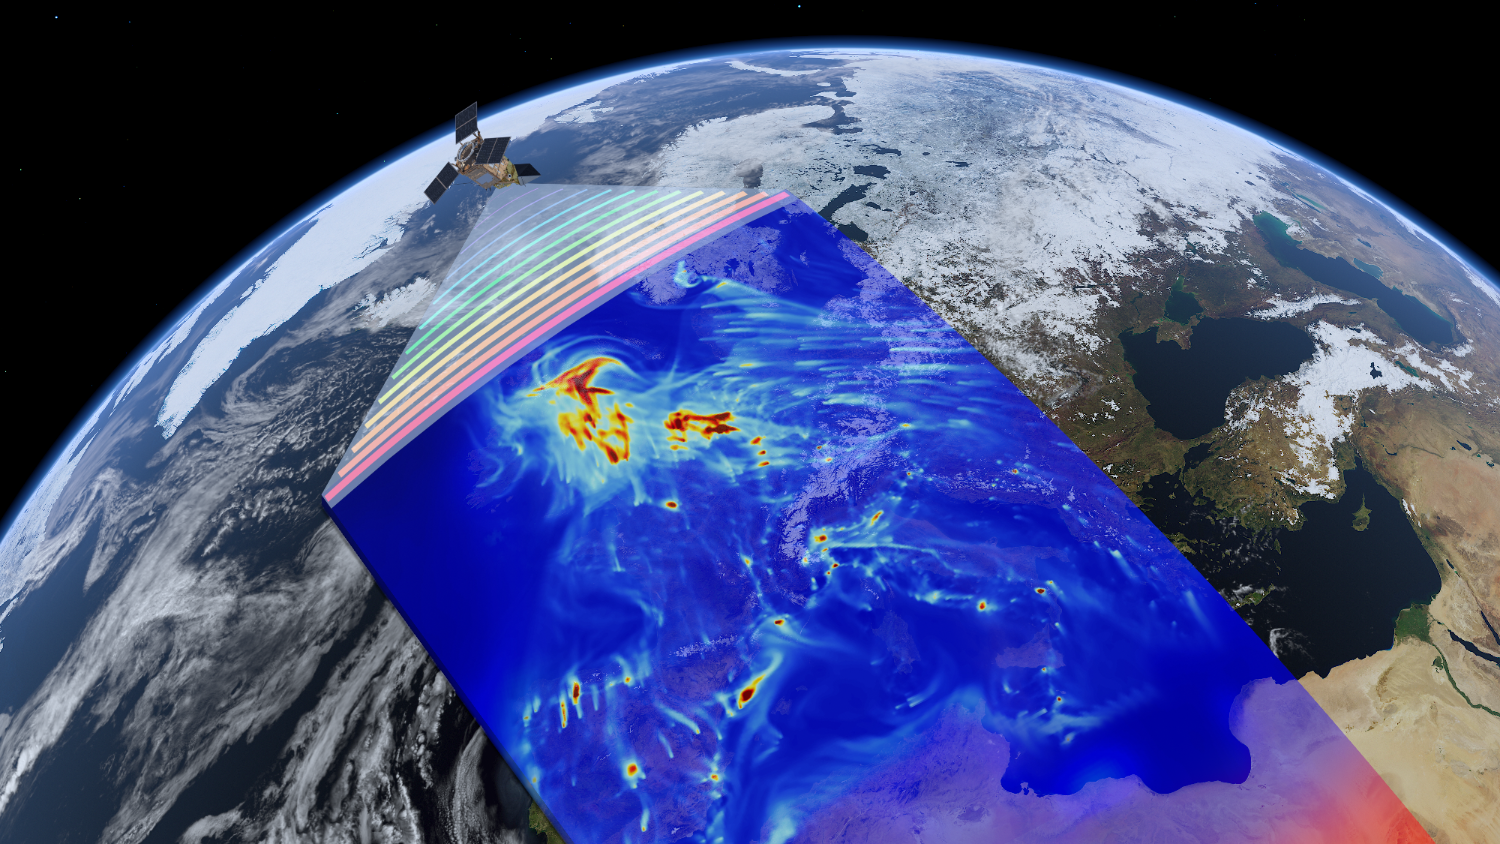
Earth observation satellites already play an important role in this matter. The Tropospheric Ozone Monitoring Instrument (TROPOMI) onboard the Sentinel-5P satellite is designed to observe and monitor various atmospheric components and air quality on a daily global basis. It monitors various atmospheric gases, such as:
- nitrogen dioxide (NO2)
- carbon monoxide (CO)
- formaldehyde (HCHO)
- sulphur dioxide (SO2)
- ozone (O3)
- absorbing aerosols
TROPOMI observes the Earth’s atmosphere from the Ultra Violet (UV) through the Shortwave Infrared (SWIR) spectral range at an unprecedented spatial resolution of 3.5 × 5.5 km2 and so it enables daily air quality monitoring at sub-urban scale.
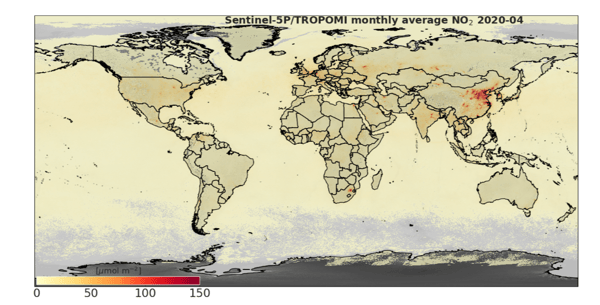 An example of the monthly average global NO2 concentrations for April 2020
The effects of the global COVID-19 lockdown
During the COVID-19 pandemic, large parts of the world were locked down, leading to considerable decreases in economic activities and road traffic. This had an effect on NO2, as this gas remains in the atmosphere for just a few hours, before it is broken down by chemical processes. Scientists from the Royal Belgian Institute for Space Aeronomy (BIRA-IASB), the Royal Netherlands Meteorological Institute (KNMI), and the European Space Agency (ESA) published a paper recently, which shows that in most European cities NO2 concentrations decreased by 30 – 50%. In various Chinese cities, reductions as large as 70% were seen, followed by an increase to nominal levels after economic activities were resumed.
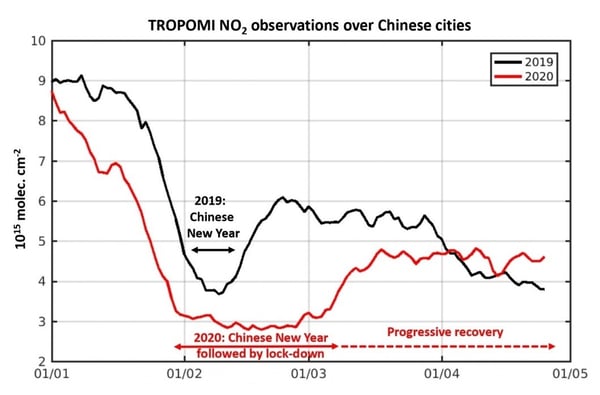 Evolution of NO2 concentrations over Chinese cities before, during, and after the lockdown. The observations from 2020 (red) are compared to those of 2019 (black). Source: BIRA-IASB website.
The decreases that were seen are not solely resulting from the lockdown. There are several factors to keep in mind, as NO2 concentration and lifetime are sensitive to meteorological conditions, such as sunlight, temperature, cloud occurrence, and wind.
A major aspect to keep in mind is that the COVID-19 lockdown has shown us, once again, that our actions have an enormous impact on our environment and that we need to change how we act and live to preserve our planet for future generations.
Making daily global NO2 concentrations accessible
Various end-user groups (e.g. public health, law enforcement, and air quality policy support) increasingly need frequent and accurate air quality information on specific air pollutants, so we joined forces with BIRA-IASB to make daily global NO2 concentration maps easily accessible to all end-users.
BIRA-IASB developed a method to compute daily and monthly global average concentrations from the original TROPOMI observations. These concentration maps will be offered via the Terrascope platform at 0.05o × 0.05o resolution to allow users to view and further analyze daily and monthly global air quality maps for NO2, CO, HCHO, and SO2 from autumn 2020 onwards.
In view of climate change, air pollution, and the urgent need for mitigation measures to be taken, it is crucial that such valuable data are made easily accessible to various stakeholders in order to facilitate accurate analyses, improved predictions, and sound decisions. Terrascope facilitates this by providing the daily and monthly air pollution maps e.g. in the EO viewer, so that users can easily view and discover the data and assess their added value for multiple applications, among others:
- air pollution monitoring
- impact assessment on vegetation and public health
- air quality forecast model improvement
- aviation warnings
- ship emissions tracking
A look on western Europe
The animation below shows how the monthly average NO2 concentration over western Europe evolved before and during the COVID-19 health crisis. The major polluted areas over London, Paris, Antwerp, Rotterdam, Amsterdam, the Ruhr industrial area, and the Po valley clearly show up throughout December 2019 and January 2020. During March and April 2020, the NO2 concentrations dropped considerably over the Po valley and the Paris region, and to a lesser extent over Belgium, the Netherlands, and the Ruhr area. The above animation of monthly averages suggests that the reduced economic activities and limited road traffic due to the imposed lockdown had a considerable positive air quality effect. However, as stated earlier, NO2 is a short-living gas and its concentration is considerably affected by meteorological conditions. Therefore to attribute the exact impact of the reduced economic activities to the concentration reduction requires careful assessment of TROPOMI observations, ground-based measurements, and atmospheric chemistry modelling.
Animation of NO2 concentrations over western Europe for December 2019 – May 2020. Concentrations increase from white – yellow – red. Grey areas indicate that insufficient high-quality NO2 observations over the respective month could be collected due to persistent cloud
These recent COVID-19 air quality improvements observed by Sentinel-5P/TROPOMI provide a peek into the cleaner air that we could breathe within the next few decades. Finally, Sentinel-5P/TROPOMI also plays a role in testing and improving Greenhouse Gas (GHG) emission models, in support of the Paris Climate Agreement and the European Green Deal zero pollution ambition.