WorldCEREAL VALIDATION APPROACH
Throughout this first phase of WorldCereal, several classification algorithms have been benchmarked for the different WorldCereal products (annual cropland, active cropland, irrigation, maize and wheat) taking into account the specific growing season. For a full description of the products, the seasons and the timing of the products, see our earlier blog.
After benchmarking and before moving to global demonstration of the products and system, the robustness of the prototypes needed to be validated on larger areas. Validation is an important part of any map production process as such it was already done over smaller areas during benchmarking, but this needed to be repeated over larger areas.
For large scale demonstration validation, we define "validation" as product comparison against independent reference data sets that were not used in the production. However, depending on a data sampling design and data quality, such a comparison could be split into statistical validation and verification against other products.
For each WorldCereal product, a different validation approach was followed:
- The annual cropland was subject to a formal statistical validation. We used a customized Geo-Wiki interface to develop a new validation data set (further the Geo-Wiki data set), satisfying all necessary requirements for statistical validation.
- The active cropland layers were compared against the Geo-Wiki data set, which also includes information about main growing season.
- The irrigation products were also compared the Geo-Wike data set, which includes information about irrigation signs but only those detectable via visual inspection of VHR imagery.
- The crop type products, a verification against available in-situ reference data was performed. A full statistical validation was not always possible due to the low availability and poor spatial distribution of the reference data.
Sampling design for annual cropland mask
We applied stratified random sampling design, employing cropland/no cropland stratification for each country. We generated 500 random locations for each stratum, in total 5 000 unique samples. The labeling of the validation data set was done using a customized Geo-Wiki interface which allowed us to validate the map doing visual interpretation of very high-resolution satellite imagery from Google maps, Google Earth, and Planet, described in Response design.
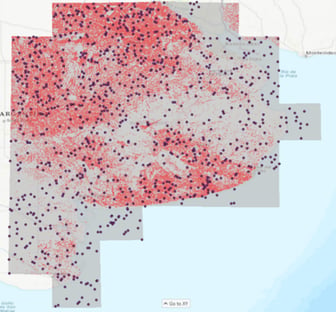
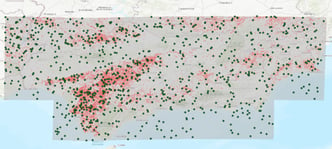
Figures 1-6 demonstrate the spatial distribution of the validation samples for Argentina, France, Spain, Tanzania, and Ukraine, respectfully.
|
|
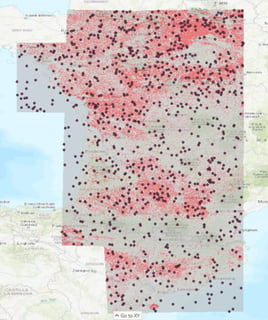 |
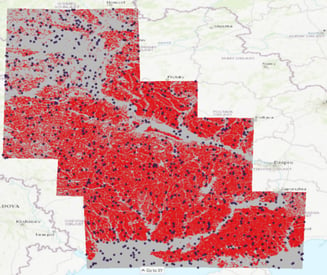
| Figure 1: Distribution of Geo-Wiki data for Argentina. The underlying layer is the annual cropland extent of Argentina, with cropland in red color. | Figure 2: Distribution of Geo-Wiki data for France (including Cataluna, Spain). The underlying layer is the annual cropland extent of France, with cropland in red color. |
|
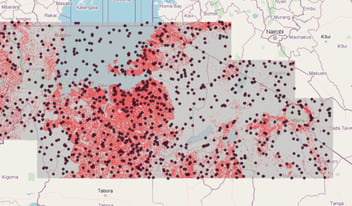 |
| Figure 3: Distribution of Geo-Wiki data for Spain. The underlying layer is the annual cropland extent of Spain, with cropland in red color. | Figure 4: Distribution of Geo-Wiki data for Tanzania. The underlying layer is the annual cropland extent of Tanzania, with cropland in red color. |
 |
| Figure 5: Distribution of Geo-Wiki data for Ukraine. The underlying layer is the annual cropland extent of Ukraine, with cropland in red color. |
To label the validation samples (Figures 1-5), we developed a customized Geo-Wiki application for visual interpretation of various sources of information. These sources include: very high resolution (VHR) imagery from Google maps, Microsoft Bing, and ESRI; Google Earth VHR historical images; Planet time series of images, Sentinel-2 time-series in False color; street level images from Google and Mappilary, and NDVI time series derived from Landsat, Proba-V and MODIS data.
Figure 6 illustrates the Geo-Wiki interface. Once a random sample was selected, a grid of 25 (5x5) cells was superimposed on it, with each cell corresponding to a 10m Sentinel pixel. The grid was necessary to count for a possible shift between the Sentinel grid and the images used for visual interpretation. In case, IIASA team observed a shift between images that could affect a decision on cropland presence, it was reported in the comment button. Left side panel of the interface include such tools as NDVI time series, Sentinel-2 time series, drawing tools to colour each cell, and information derived from AEZ layer on growing seasons in a given location. Right side panel has links to Planet data explorer and Google Earth application with historical images and street level photography, as well as given classes to label each cell: rain fed cropland, irrigated cropland, active cropland (if irrigation regime is not sure), and 'not sure' for those cases if there is not enough of data to confirm cropland presence. Also, on the right side panel, there is a list of growing seasons to be selected for each sample site.
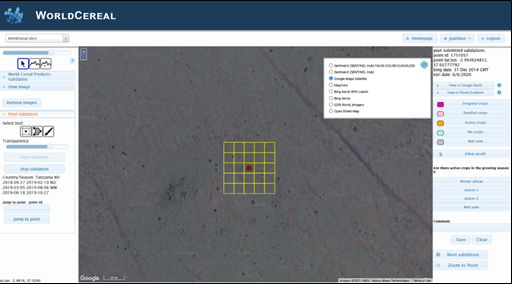
Figure 6: The customized Geo-Wiki interface used for validating annual and active cropland in a season as well as irrigation products. Links to visualize the location being validated using Google Earth and Planet Explorer time series satellite imagery were included in the interface.
As an example the results for cropland validation in Ukraine are shown in table 1.
| Annual cropland | Geo-Wiki data | User accuracy | Confidence intervals (95%) | |
| No cropland | Cropland | |||
| No cropland | 46.2% | 2.4% | 95.1% | 1.9% |
| Cropland | 1.9% | 49.5% | 96.2% | 1.7% |
| Producer accuracy | 96.0% | 96.0% | ||
| Confidence intervals (95%) | 1.9% | 1.6% | ||
| Overall accuracy | 95.7% | 1.3% | ||
Table 1: Validation of the annual cropland extent with Geo-Wiki data. Confusion matrix (in %) for Ukraine.
irrigation products
There is very little information available about irrigation regimes of the WorldCereal Large Scale Demonstration products. Copernicus Corine Land Cover land use map contains such classes as rainfed and irrigated cropland, but it was not used in the comparison exercise since the latest map's version is for the year 2018 but not 2019. As such a real validation was not possible. For the next phase extra effort on irrigation data sets is needed. For this effort we could use the help from the agricultural monitoring community.
active croplands
For this product there are no equivalent maps available, as such validation was done based upon GeoWiki validation, main growing season was determined based on analysis within GeoWiki and compared to the active cropland markers.
Table 2 shows the results of comparison of the data collected via Geo-Wiki on the main growing seasons. There is very high agreement for winter and summer crops. In case of winter drops, the agreement is 100%.
| Seasons | Agreement with Geo-Wiki data |
| Winter | 100.0% |
| Summer | 80.8% |
Table 2: Verification of active cropland in a season. Comparison with Geo-Wiki data for Spain.
comparison with independent reference data sets for crop type maps
We used the subset of reference data that was not used in the map production process and corresponds to the mapped growing seasons of WorldCereal products. Crop types are dynamic and change from growing season to growing season. Therefor, the validation data set on crop types should have been collected exactly in the same growing seasons as the delivered WorldCereal products.
As example we show the validation for France based on the LPIS data sets. The LPIS data set is very rich since it contains information about growing seasons, winter and summer. This means it could be also used to validate seasonal maps.
Table 3 shows the results of comparison with the LPIS data. Overall, there is very high agreement for maize and wheat. Wheat is confused mainly with barely. In table 4 we have combined wheat with other cereals and as expected the overall agreement is higher.
| Crop types | 2019 LPIS data set | Agreement | |||||
| other cropland | other cereal | wheat | winter wheat | spring wheat | maize | ||
| Other cropland |
549 | 38 | 9 | 11 | 0 | 47 | 83.9% |
| Other cereals | 55 | 345 | 1 | 14 | 0 | 5 | 82.1% |
| Wheat | 31 | 287 | 1 | 956 | 3 | 12 | 74.4% |
| Maize | 24 | 30 | 1 | 1 | 0 | 750 | 93.1% |
| Agreement | 83.3% | 49.3% | 96.3% | 92.1% | 82.1% | ||
Table 3: Comparison of the crop type products with the 2019 France LPIS, wheat separated from other cereals.
| World Cereal crop types | 2019 LPIS data set | Agreement | |||||
| other cropland | other cereals | wheat | winter wheat | spring wheat | maize | ||
| Other crops | 555 | 43 | 10 | 11 | 0 | 50 | 83.0% |
| Cereals | 80 | 627 | 1 | 970 | 3 | 14 | 94.5% |
| Maize | 24 | 30 | 1 | 1 | 0 | 750 | 93.1% |
| Agreement | 84.2% | 94.3% | 92.1% | 91.7% | |||
Table 4: Comparison of the crop type products with the 2019 France LPIS data, wheat merged with other cereals.
conclusion
In conclusion it can be said that, the annual cropland extent for all 5 countries has been mapped with good accuracy (>89%). The products for France and Ukraine were the best in terms of quality, with overall accuracy higher than 95%. The cropland extent of Argentina was also very good with overall accuracy around 90%. While for Spain and Tanzania, we received lower accuracy numbers for cropland. The cropland extent in Spain and Tanzania has been overestimated due to the confusion with natural vegetation, such as grasslands and mixed woody landscapes.
The mapped crop types for all countries agreed well with the existing reference data sets. As mentioned earlier, we had a detailed crop type information derived from the 2019 France LPIS data and the SIGPAC data set for Cataluña. Based on the comparison with these two data sets, we could say with high confidence that the maize fields were mapped very well (user's accuracies >84%). Wheat fields were mapped rather good (user's accuracies >70%) but confused with barley. Active cropland in a season are unique layers by definition. There is no existing reference data available to validate such layers. Here, we have compared these layers with the newly collected Geo-Wiki data and found a very high overall agreement (>90%).
Overall, the validation of the World Cereal products is a difficult process since there is very little information available, in particular for crop types and irrigation regimes.
As such, for the next phase we will have to rely on local expertise and the agricultural monitoring community to support us with:
- Geolocated, time stamped, in situ data sets for crop type, irrigation and cropland
- Local expertise for validation of the product
If you are interested in supporting us, please reach out:

We are looking forward to future collaboration, meeting you in the WorldCereal training sessions during ESA Living Planet Symposium and receiving your feedback and validation of the WorldCereal products.
Special thanks to Myroslava Lesiv and Juan-Carlos laso Bayas (IIASA).

/Blog_WorldCereal_1200x650.png)
/lewis-latham-0huRqQjz81A-unsplash.jpg)
/background_image_blog.jpg)