
An opensource toolbox to extract valuable insights
FuseTS is an open-source toolbox that provides access to different algorithms for data fusion and time series analytics. Based on Python and available on GitHub, the FuseTS library provides a solid foundation for data fusion and time series analytics. It offers essential data fusion and smoothing services, such as Whittaker and Multi-Output Gaussian Process Regression (MOGPR). Moreover, FuseTS offers advanced functionalities to elevate your data fusion pipeline by detecting peaks and valleys or extracting phenology metrics.

The FuseTS Python library enables the seamless execution of the different algorithms on both local xarray data structures and through openEO, a community standard for EO processing. In this post, I’ll focus on the usage of FuseTS through openEO by providing an example workflow.
Calculating Phenology Metrics from fused Sentinel Data Streams
Let me demonstrate how to use FuseTS's Multi-Output Gaussian Process Regression (MOGPR) and Phenology services to fuse Sentinel-1 and Sentinel-2 data and use this fused data stream to extract phenology metrics. This is a common and valuable use case due to the challenges caused by cloud obstructions in Sentinel-2 data. Such obstacles present difficulties when calculating consistent and accurate land surface phenology metrics, for example, the start, peak, and end of a season which play a key role in tracking plant development, estimating crop yields, and guaranteeing food security.
By using FuseTS's MOGPR service, you can leverage the benefits of Sentinel-1 data to create a cloud-free and consistent stream of Sentinel-2 data. Moreover, the Phenology service from FuseTS allows you to extract relevant land surface phenology metrics directly from the fused data stream. The full code of this example is available as a Jupyter Notebook at the FuseTS GitHub.
- Setting up openEO for FuseTS usage
Before we start, it's important to highlight some prerequisites to execute the code from this post:
- You need to have a basic understanding op openEO. For more information on openEO concepts and getting started with its Python client, you can check the openEO Documentation.
- You need a Python environment with the openEO package installed.
- To access the processing resources provided by openEO, sign up for the free trial at openEO Platform to claim your 1000 free credits. These credits ensure you can experiment with openEO and execute the code in this post.

- Creating a fused data stream
As a first step, you will create a fused data stream using Sentinel-1 and Sentinel-2 data. In this example, you’ll fuse the RVI ASC and NDVI datasets using MOGPR. This is achieved through the following code: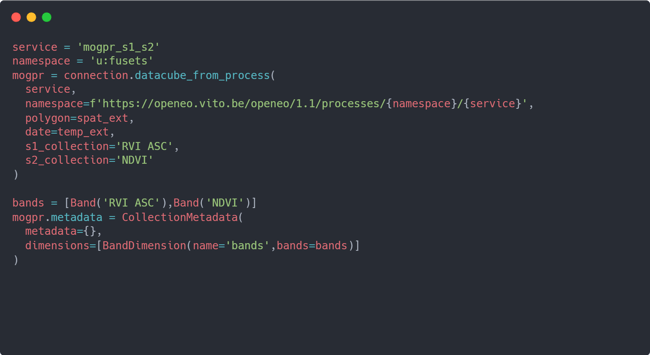 The service and namespace in the code example are crucial parameters to select the FuseTS service for openEO to execute. In this case, you need to use the mogpr_s1_s2 service. This FuseTS service allows you to fuse predefined Sentinel-1 and Sentinel-2 collections using the MOGPR algorithm. Alternatively, FuseTS also provides a dedicated mogpr service that enables you to create your own input data streams for generating a fused output stream.
To execute the service, you can use the datacube_from_process function provided by openEO. In addition to providing the service and namespace, it also accepts the input parameters of the service. In this case, the following parameters are specified:
- Polygon (required): The spatial extent of data fusion, formatted in a valid GeoJSON geometry structure.
- Date (required): Temporal extent of the fused output data stream.
- S1_collection (optional): One of the predefined S1 collections to use as input for the data fusion process.
- S2_collection (optional): One of the predefined S2 collections to use as input for the data fusion process.
- Calculating phenology metrics
To calculate the phenology metrics, you can use the phenology service from the FuseTS toolbox. This can be achieved by adding the following code to your script: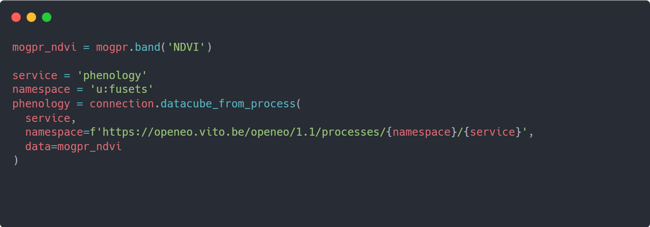 Can you spot the similarities with adding this new process and calling the mogpr_s1_s2 service from previous step? The general principle remains the same. By calling datacube_cube_from_process, you can also execute FuseTS’s phenology service. However, this service only accepts a single parameter called data. The data parameter should represent a valid datacube that is used for calculating the phenology metrics. In this example, you use the mogpr_ndvi datacube constructed by selecting the NDVI band from the mogpr datacube created in the previous step.
 - Downloading the results
Finally, now that you have constructed a workflow using openEO processes, you can ask openEO to execute the processes and download the result to a local environment in NetCDF format. This can be achieved using the following code: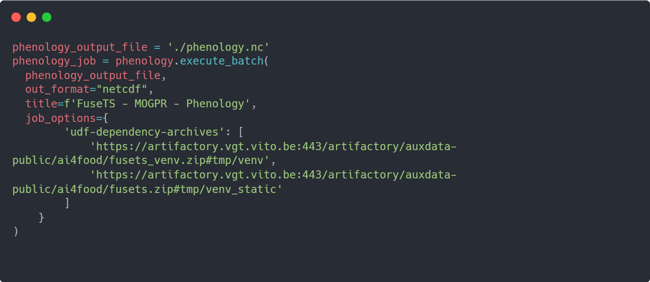
The above code will take the phenology datacube, created in previous step and execute it as an openEO batch job. The result will be downloaded to a local NetCDF file with the name phenology.nc. Note that it's crucial to specify the job_options in the code to enable openEO to utilize the various FuseTS services on its backend.
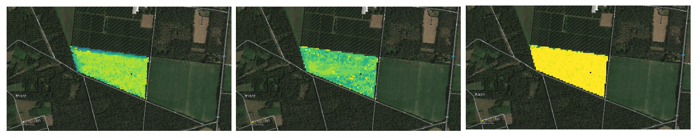 Resulting values for start, peak and end of season
Set up more data fusion and analytics workflows
As demonstrated in this example, using FuseTS services through openEO is a straightforward process. A basic understanding of openEO is all you need to set up data fusion and analytics workflows with FuseTS. While this example highlighted only two functions of the FuseTS toolbox, it offers much more. You can explore the additional openEO-based services through the notebooks that are available on GitHub or on various online marketplaces:
• openEO Platform User Portal
• Copernicus Data Space Ecosystem Algorithm Plaza
• TerraScope EOplaza
Discover more about the FuseTS toolbox on GitHub. You can dive into one of the many notebook examples demonstrating the utilization of the FuseTS services, both on local files and as on-demand processes through openEO. Start using the FuseTS toolbox to harness the power of data fusion and advanced time series analytics for Sentinel-1 and Sentinel-2 data in your projects!

/Blog_CORSA_1200x650.png)
/lewis-latham-0huRqQjz81A-unsplash.jpg)
/boudewijn-huysmans-_iyh6g5KHQA-unsplash.jpg)