Monitoring EU's CAP with satellite data
The EU’s Common Agricultural Policy (CAP) is designed to support farmers in order to ensure food safety in a context of climate change. Every farmer who receives area-based CAP payments is obliged to abide by climate and environmentally friendly practices. In Flanders, the Department of Agriculture and Fisheries supervises the correct and timely implementation of different policy measures based on sample checks of farmers’ fields.
High resolution satellite images enable additional automated and objective information that allows a better area-wide follow-up, guidance and supervision. Also, possible crop damage due to weather extremes and expected over- or underproductivity due to standard variability could be assessed more quickly and objectively. The CAPSAT project showed us how we can use Earth observation data and remote sensing technology to better detect crops and quantify yields, an essential part of the agricultural value chain. In subsequent steps, it will be evaluated how this will evolve in a recurrent operational service.
Early crop mapping
In a first step, Sentinel data is used to reliably map what grows where. A nice example of this is the Cropmap 2020 for Belgium which give you an overview of the Belgian agricultural landscape and more specifically the main crop types on each field cultivated in the 2020 growing season. This case study clearly shows how we use advanced deep learning techniques to fully automatically detect agricultural field boundaries and recognize the crop types based on joint Sentinel-1 and Sentinel-2 radar and optical imagery.
Current efforts focus on within season multiple cropping such as cash vegetable crops, cover crops, crop mixtures and grass undersown in other crops. A service on major arable crops is already operational as part of the WatchItGrow platform.
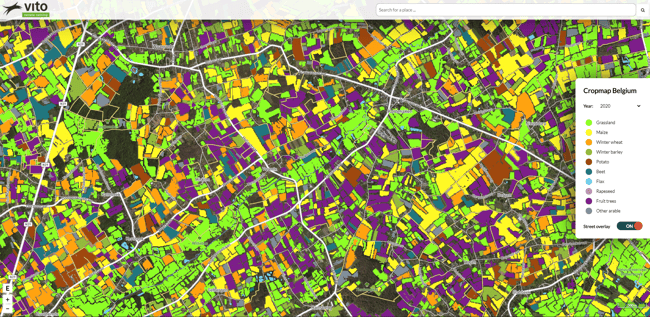
Preview of the Cropmap Belgium, crop mapping based on Sentinel-1 and Sentinel-2 data
Quantifying crop yield
CropSAR is a Terrascope service that combines Sentinel-1 radar with Sentinel-2 optical images. Fusing this data using new deep learning technology makes it possible to fill the cloud, haze, and shadow induced gaps. Kristof Van Tricht, one of our agricultural experts, explains more about this technology in one of his articles 'Looking through the clouds to improve crop monitoring'.
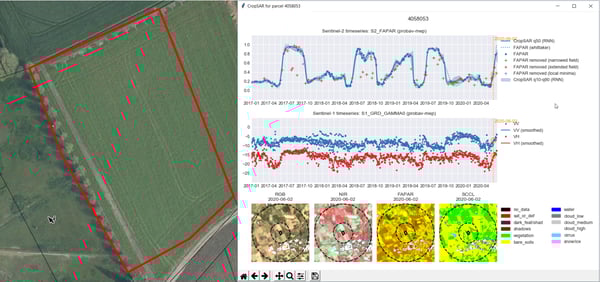
Quering the Terascope CropSAR backend solely based on web services,
hereby eliminating the need to download or process satellite imagery
The CropSAR service delivers on-demand phenology time series for a user-specified area via web-services. Here, the observed phenology is the expression of plant growth as influenced by plant species/variety and agro-ecological conditions such as soil type, nutrients, and local weather. The phenological curve is available at a spatial resolution of 10 m and a temporal resolution of about 3 days.
The Flemish Department of Agriculture and Fisheries maintains crop yield records at the farm level. By combining – again, state-of-the-art AI techniques – the phenology curves with farm data, a function is established between the satellite observed phenology and the registered crop yield.
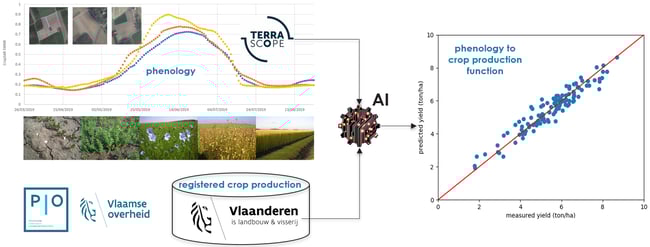
Phenology curves for flax demonstrating the link with crop development and crop yield
During the CAPSAT proof of concept project this was achieved for the following crops: maize, wheat, barley, potato, sugar beet, grass and flax. Eighty percent of the yield estimations had a maximum deviation from measured yields of 20% for flax and sugar beet, 30% for wheat, barley and late potato, and 40% for maize. For grass, the yield records in the official databases appeared to be insufficient to derive a data-driven yield model. This exercise pinpointed some data collection issues of within-field yield data. However, the advances in measuring/weighing technology that can be installed in combine harvesters offer opportunities for obtaining intra-field yields. This will enable more accurate yield estimations across the farm to region in the future.
“The possibilities of AI combined with the growing amount of orthoimages available is drastically changing the way we can follow up agriculture as a government administration. Step by step we can move from asking the farmer everything we want to know to using modern technology to detect what we need to know.”
Tim Ghysels - Department of Agriculture and Fisheries
This project clearly demonstrated the potential of combining expert knowledge stored in local Governmental databases with the Sentinel earth observation data. Governments and sector organizations have an important role in how to handle these new data driven insights. Open discussions on what can be open data and which data is better to remain private might prevent disruption in the economic value chain of a sector.
---------------------
The CAPSAT project enabled a public private partnership, and was funded by the Department of Agriculture and Fisheries and the Programme for Innovation Procurement of the Department of Economy, Science and Innovation. The project is also linked with the EODAS programme (Earth Observation Data Science) of Flanders Information Agency, focused on introducing digital innovation in the Flemish Government.

/Blog_CORSA_1200x650.png)
/Blog_WorldCereal_1200x650.png)
/lewis-latham-0huRqQjz81A-unsplash.jpg)