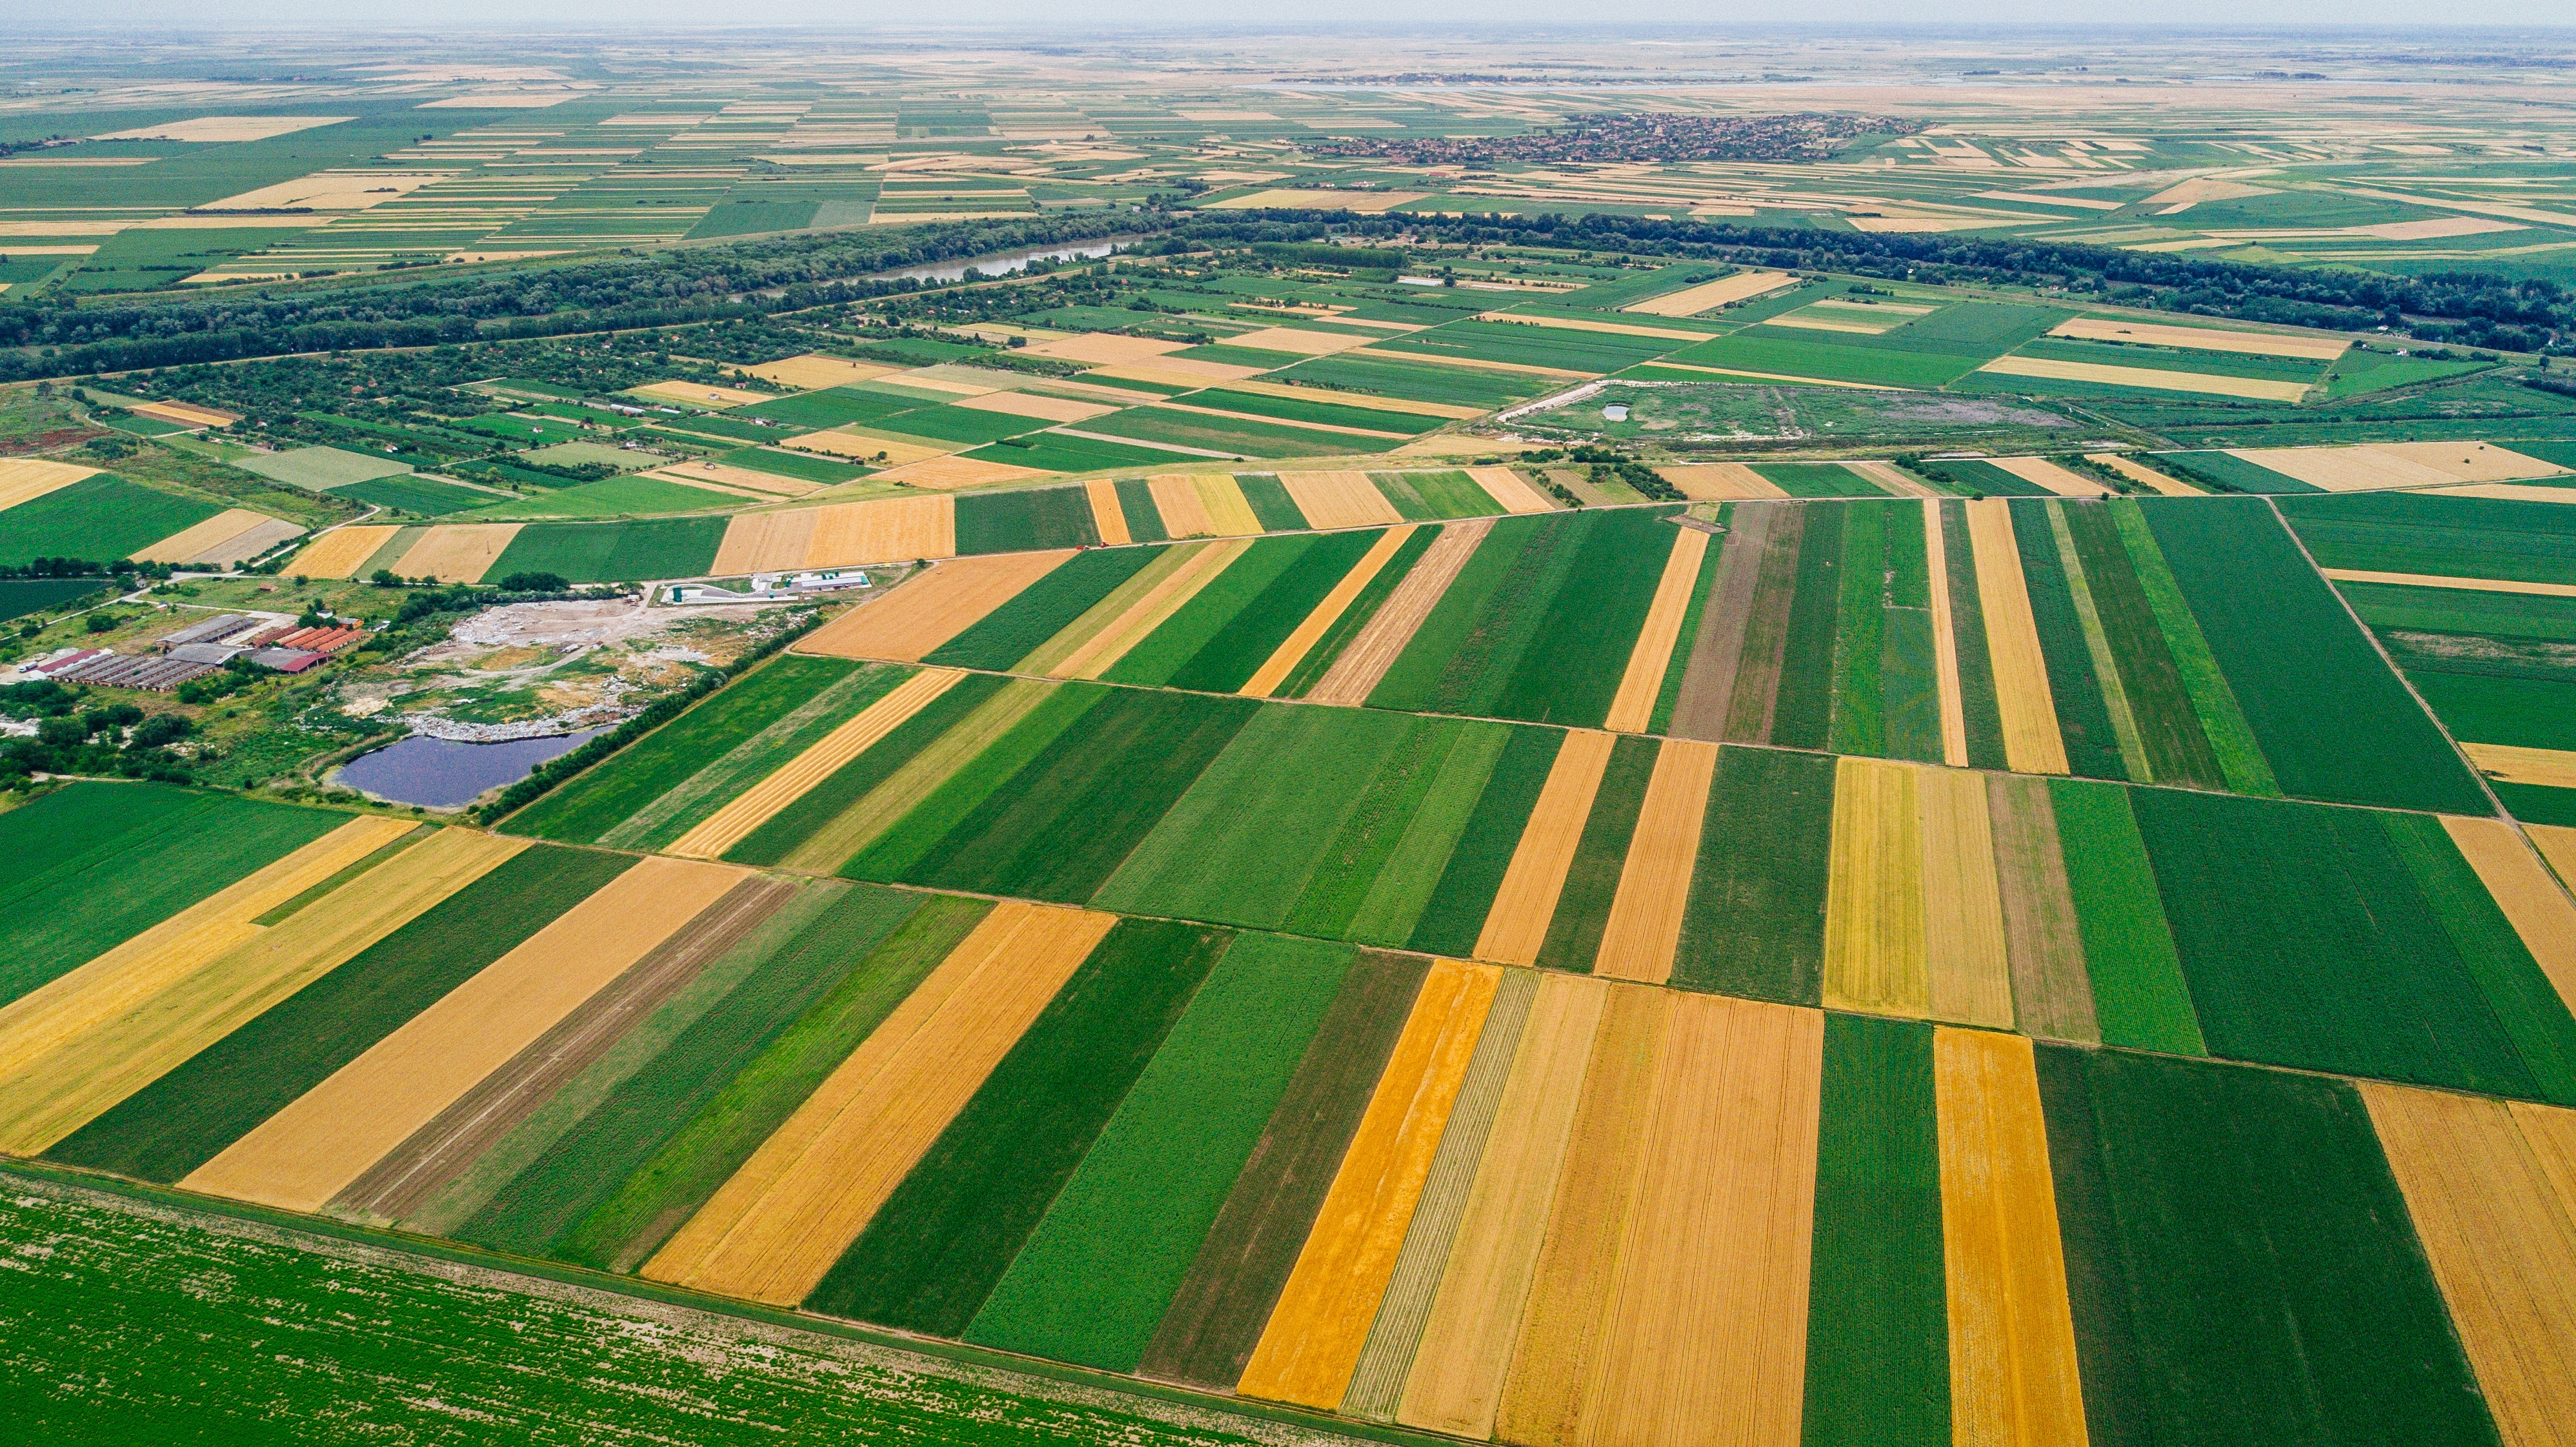
Crop type mapping: a challenging task
Crop type mapping is a challenging task, however. Most of us recognize a field with maize plants, while identifying a potato field is already slightly more difficult. Distinguishing between winter wheat and winter barley is probably a task for experts only.
If on-site crop type information is unavailable, we have to rely on techniques that can do this remotely. The beauty of using satellites to perform this task is that we can cover any region in the world with the same instruments, without ever having to visit every single field. But there are factors that make it extremely difficult to identify crop types using satellite data:
- different planting dates,
- specific management practices,
- irregular fields,
- crop species that look similar,
- regional growing season differences,
- clouds that obscure the view from space
However, by using the right satellite data and combining these with state-of-the-art software technology, we can tackle these issues and retrieve a crop type map from space, which can ultimately help ensuring worldwide food supplies.
Key concepts to tackle the problem
In order to map different types of crops at regional scale, you need to get your basic input right. In our crop mapping approach we rely on three important concepts to cope with the difficulties and disturbing elements.
- Automatic detection of agricultural parcels to purify the signal
Instead of looking at individual pixels with a resolution of 10 m, looking at the entire field at once enhances our capability of seeing very subtle differences between crop species. Therefore, using a deep learning approach, imagery from Sentinel-2 is used to automatically delineate individual parcels. From there on, we perform further analysis at parcel level, resulting in much purer satellite signals.

A deep convolutional neural network automatically extracts agricultural
parcel boundaries from Sentinel-2 imagery
- Closely watching the growing season to separate crop species
Looking at one acquisition from space is not sufficient to detect subtle differences between crop types. Generally speaking, at some point in the growing season, they all look green from above! Key to a good identification is to watch these fields closely as the crops start growing, flowering, maturing, and eventually get harvested. Only then the differences between crop species become really apparent.

Sentinel-2 FAPAR values for a winter wheat and a potato field show the strong differences in growing seasons for these two crop species, where winter wheat peaks much earlier in the season than potato.
- Complement optical with radar to optimize detection
While the more traditional optical imagery from Sentinel-2 allows us to look at biophysical properties of plants (e.g. health and productivity), it can now be complemented by Sentinel-1, a radar sensor which allows us to look at plant structural properties as well (e.g. elongated plant structures of maize vs. low closed canopy structures of potato). The Sentinel-1 radar can also look through clouds. This greatly improves our ability to identify crop species from a satellite point of view.
We use a deep neural network that is trained to cope with these very different signals from Sentinel-1 and Sentinel-2 to identify the different crop types.
A Belgian cropmap into practise
These three concepts were put to work to produce an early-season crop map for Belgium. Input data consist of Sentinel-1 and Sentinel-2 time series from January 1st until June 15th. We focus on the major crop types in Belgium: maize, winter wheat, winter barley, potato, and beet. In addition, we map grassland and fruit trees, and we keep one class for arable crops that are cultivated less frequently.
A view of the crop map which gives an early estimate of the 2018 agricultural
landscape in Belgium. Click on the image to zoom in or discover
the application via https://app.watchitgrow.be/cropmap
By comparing these results to some of the farmer’s parcel declarations, we found that the accuracy of this crop map is 87%. Winter wheat and winter barley are identified with very good accuracy, as these crops are already near the end of their growing season. Other crops which are only halfway their growing season, have a slightly higher chance of confusion. Potato and beet, for example, are sometimes confused in this stage of the season.
The way forward
On the 15th of June, the growing season was only just coming at pace. In addition, the 2018 growing season started with a very dry period, causing significant variability in planting dates, a challenging task for classification!
For now, the crop map gives an early estimate of the 2018 agricultural landscape in Belgium. The encouraging 87% overall accuracy at this point is likely to increase when imagery from the second half of June and from July, are added to the classification procedure. This crop map is therefore a dynamic product which should constantly be improved while progressing into the growing season as more satellite imagery is coming in. From next season on wards we will integrate this crop map in watchITgrow, the crop monitoring tool for all arable fields in Belgium.
In the end, we can use this procedure, with some region-specific adjustments, to produce crop maps in different regions around the world, thereby providing one key element in the global battle against food shortages.


/Blog%20Post%20Strip%20Cropping%20-%20Featured%20Image%201200x650%20150%20ppi.png)
/Blog_WorldCereal_1200x650.png)
/lewis-latham-0huRqQjz81A-unsplash.jpg)