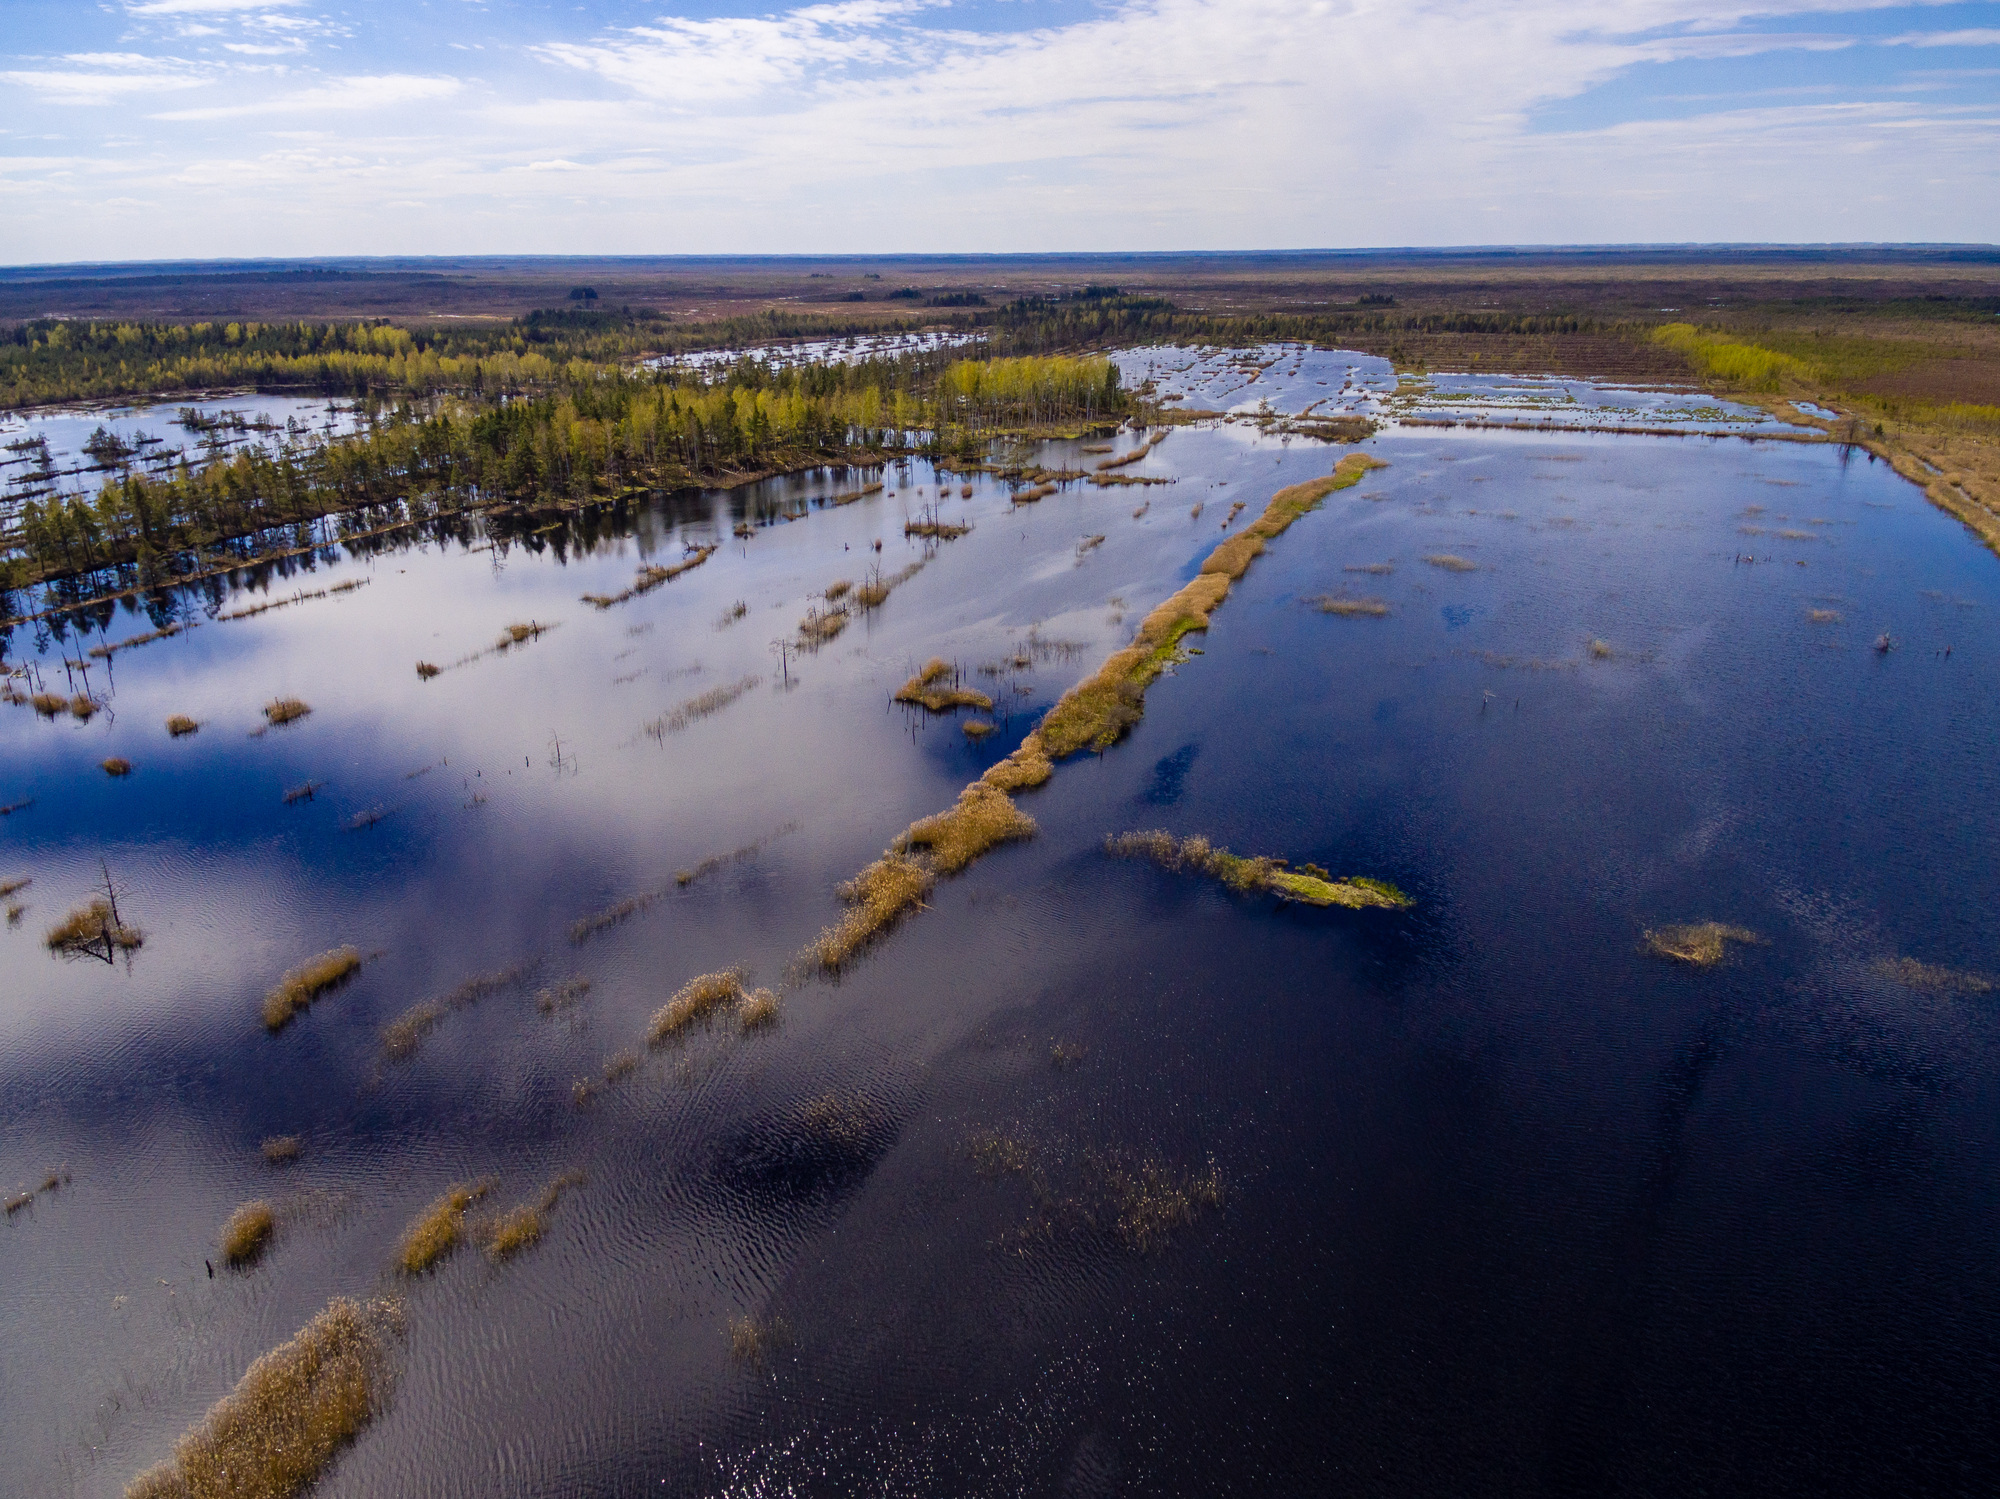
Daily depth surveys of the Scheldt
The Port of Antwerp is the second largest in Europe (and 13th globally). It is a seaport in the heart of Europe accessible to the largest ships in the world, but it is located 80 km inland at the upper end of the tidal estuary of the river Scheldt. To keep the river navigable by these ships, daily dredging efforts are required.
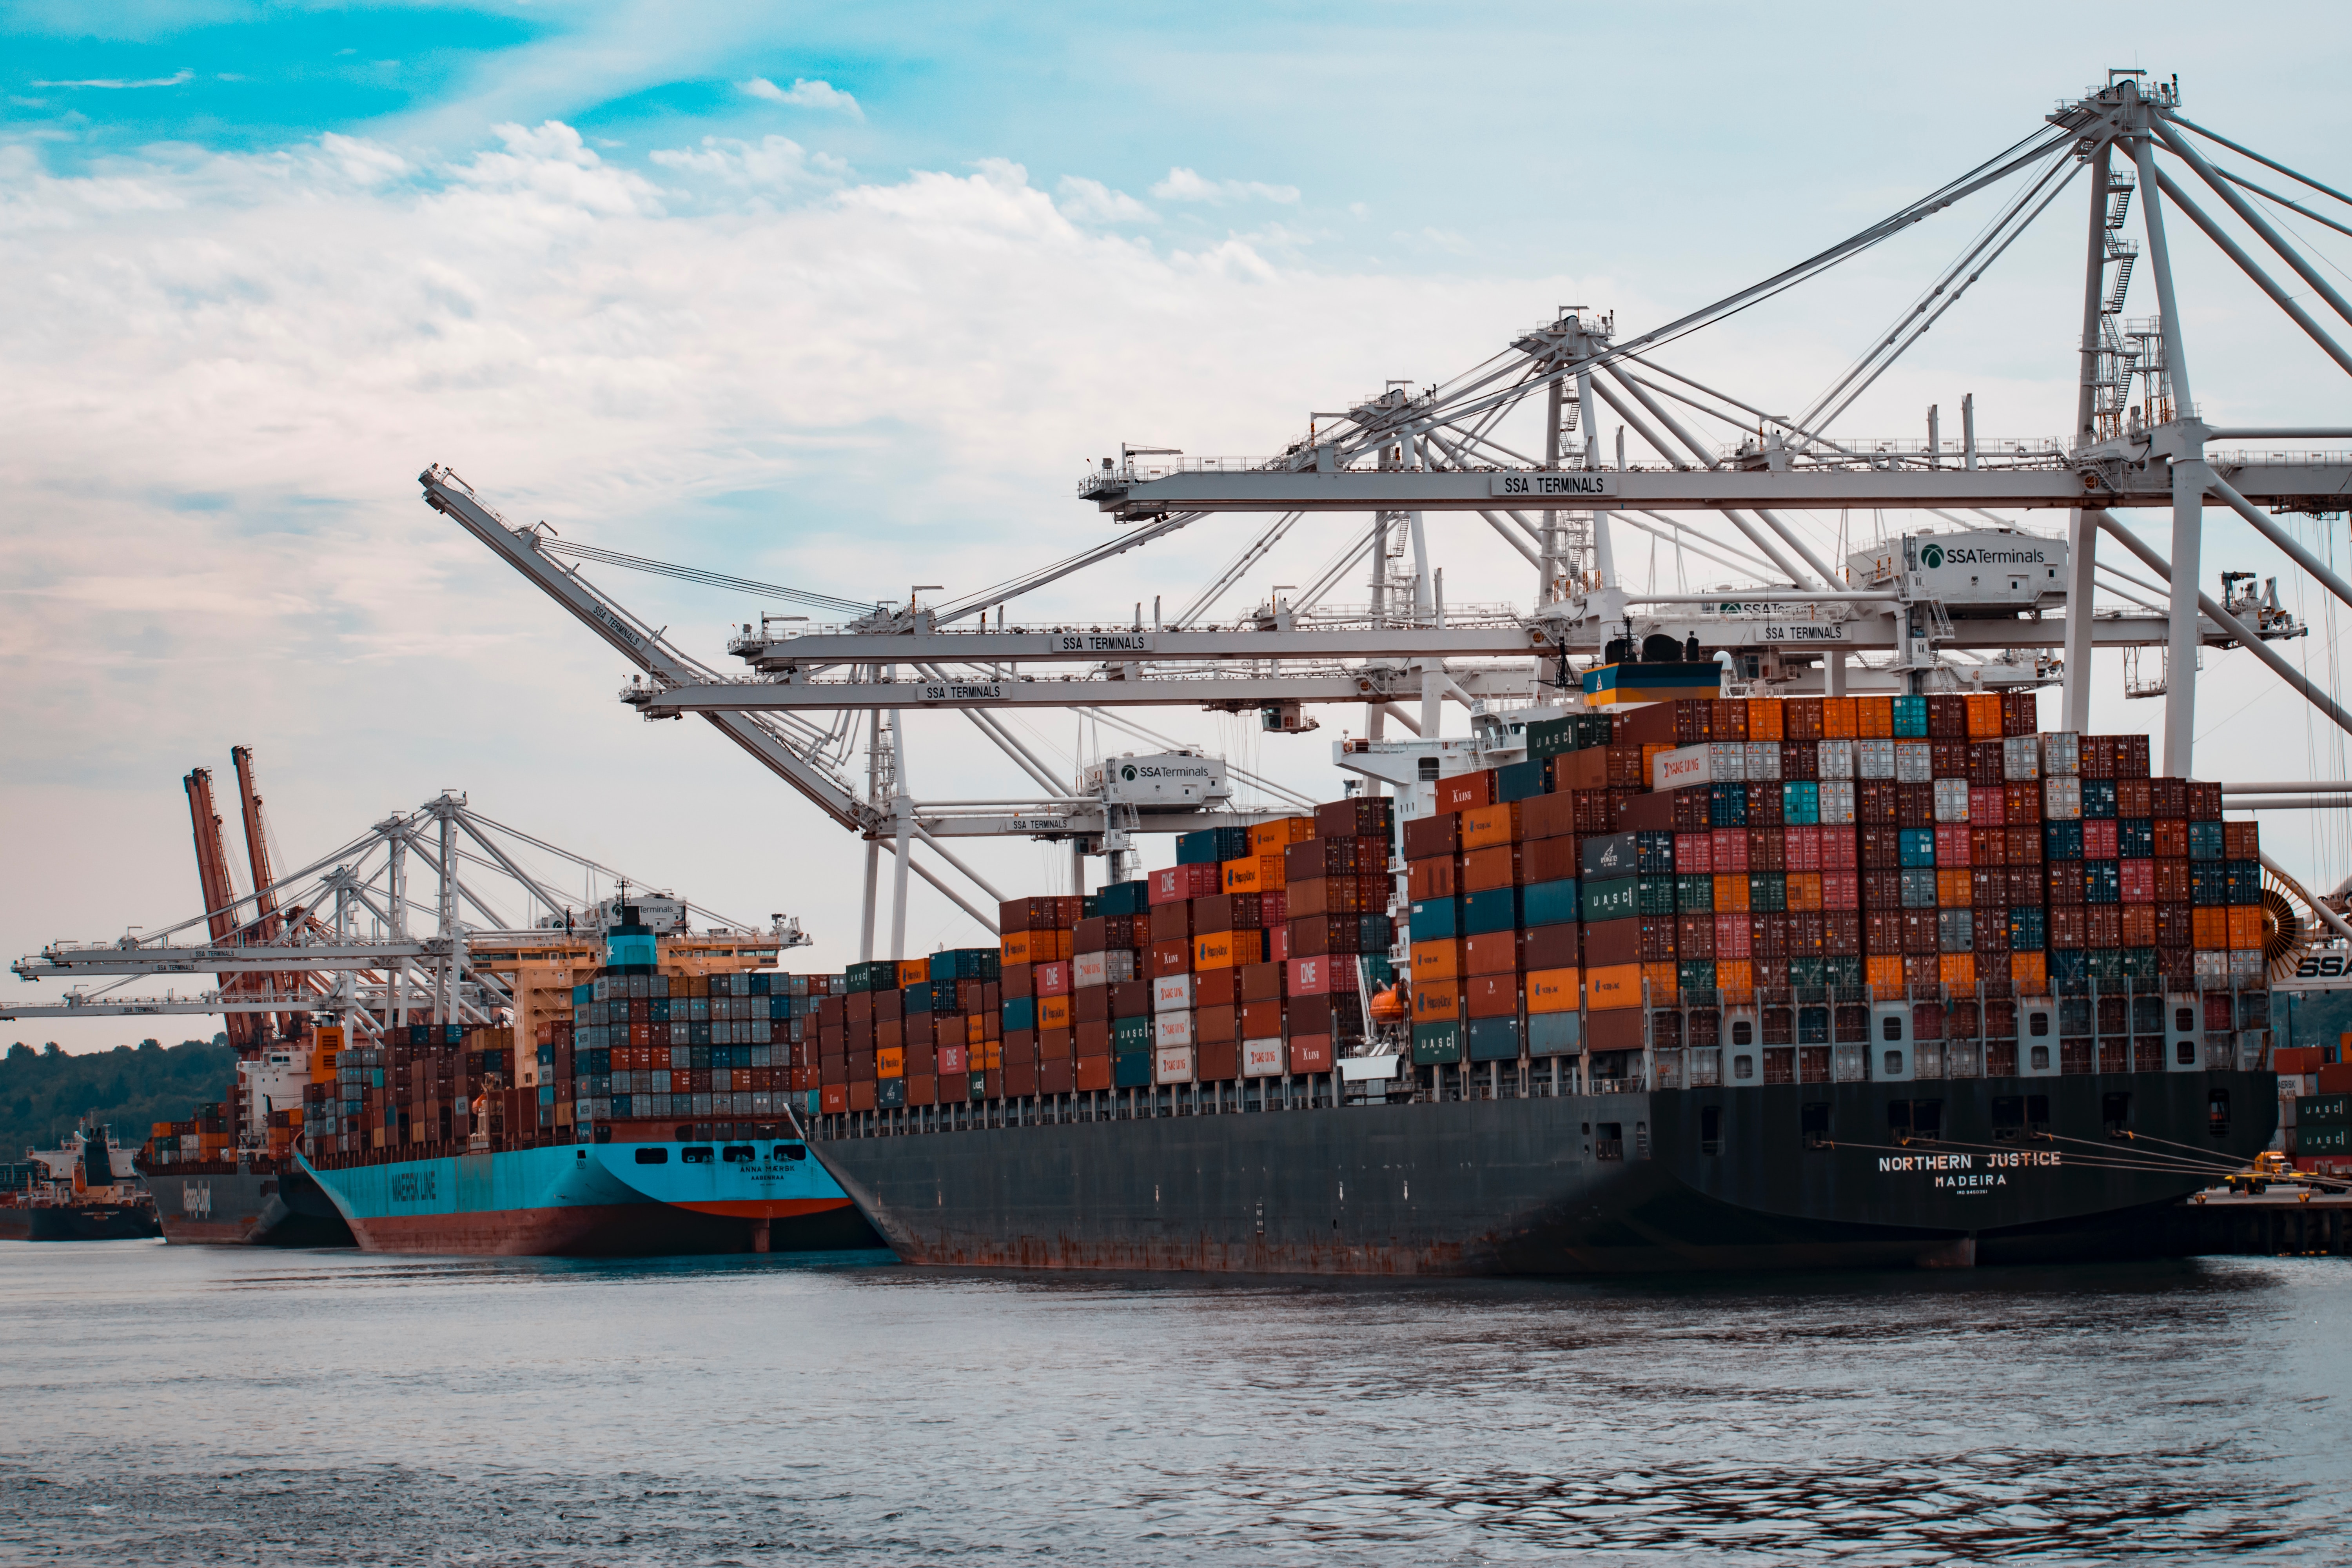
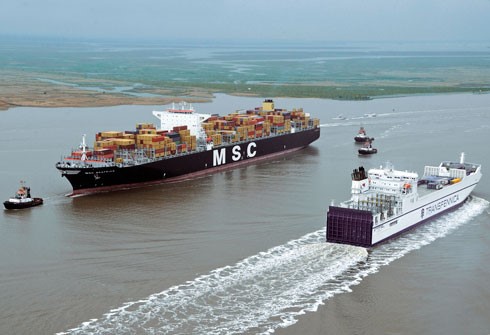 Pilotage of large cargo ships on the river Scheldt
To safeguard the sea access and ensure the passage of the large cargo ships, the Flemish hydrological service conducts daily depth surveys of the Scheldt, the Scheldt estuary and the Belgian Continental Shelf (i.e. the Territorial Sea and the Economic Exclusive Zone of Belgium). These surveys provide bathymetric data that serve as input for the dredging activities coordinated by the Flemish Government. This is done by means of depth maps that are generated from the raw bathymetric data.
However, until recently the method of map generation followed a labour intensive workflow and only allowed the end user to see a single snapshot in time of the depth soundings. Today, “waterborne” remote sensing and GIS are used to upscale these monitoring efforts while reducing time and effort.
Reducing processing time and cost
To set up a sustainable processing and visualization workflow using waterborne remote sensing and GIS we had to take into account some specific challenges and requirements.
The workflow has to process a vast amount and variety of raw input data (multibeam and single beam) and offer a specific versioning engine (patent pending) to reply to the need for data versioning as new data might not be uploaded in the correct time sequential order. Another important challenge was the need for high performance visualization because the end-users use visual data exploration as a significant part of their work.
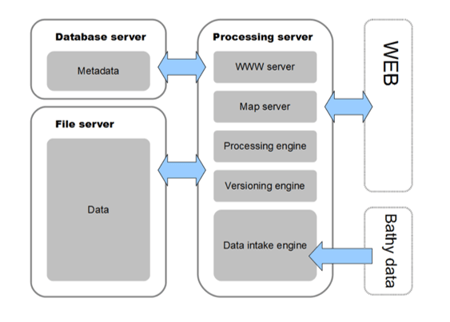 System architecture overview
Keeping these specific requirements in mind the new bathymetric layers were integrated in a Geographical Information System, called 'MISTER', which gives the end users several advantages including:
- optimizing data storage (no storage-intensive caching)
- allowing on the fly reconstruction of seamless bathymetric data layers for any type of bathymetric data
- facilitating insertion/deletion of new raster data at any moment in time
- providing derivative products such as difference images and contour lines as real-time seamless visual products instead of pre-rendered/processed data
This approach was made possible by offloading highly CPU intensive processing to a GPU (Graphical Processing Unit), optimized for such calculations. - reducing disc storage at the user side
The data intake engine automatically detects new data and then starts processing. The result is an updated metadata database and versioned raster tiles on the file server, which allows for efficient querying, visualization and processing via standard OGC services and open REST interfaces. Automation of the data intake reduces data delivery times from several weeks to a few days.
All relevant data offered in one GIS
MISTER, developed by the Flemish Government, provides a fast and efficient access to the most recent (but also historical) bathymetric data, delivered as a seamless data layer, completely hiding the complexity of the data management for the-end user. It combines the bathymetric layers with all relevant data on the Scheldt, the Belgian Continental Shelf and the surrounding land.
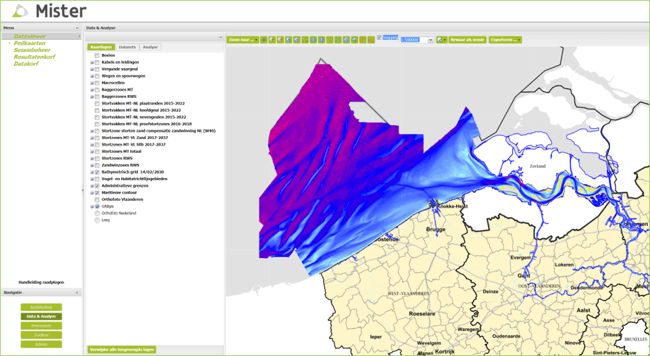 The GIS 'MISTER' bringing together all relevant geo-information on the Scheldt
By bringing together the essential geo-information for the port of Antwerp users can easily request information on:
- dredging and deposition areas
- the actual navigation channel
- the location of buoys & pipes
- protected nature areas
- real-time ship location
Recently the bathymetric data was also combined with a LiDAR-derived DTM of the surrounding land.

/Blog_WorldCereal_1200x650.png)
/Land%20use%20model%20+%20green%20city.png)