Water, a limited resource
There is the rising demand for crops globally, and at the same time, fresh water is becoming increasingly scarce in many parts of the world. This is not just a problem in arid and semi-arid regions. Prolonged periods of drought happen everywhere, even in Belgium. It is predicted that almost the entire African continent and the Near-East will suffer from water scarcity by 2025.
Monitoring water productivity
Given the pressure on water resources, it is crucial to monitor how efficiently farmers are using the available water. One of possible ways to do so is by assessing the amount of biomass produced per cubic metre of water consumed: the water productivity. To this end, the Food and Agricultural Organisation of the United Nations (FAO) is currently developing WaPOR, an operational and open access database, to monitor agricultural water productivity in near real time.
With this information users can:
- find regions where water productivity is too low
- propose solutions to use water more efficiently
- reduce water stress
- contribute to a sustainable increase of agricultural production

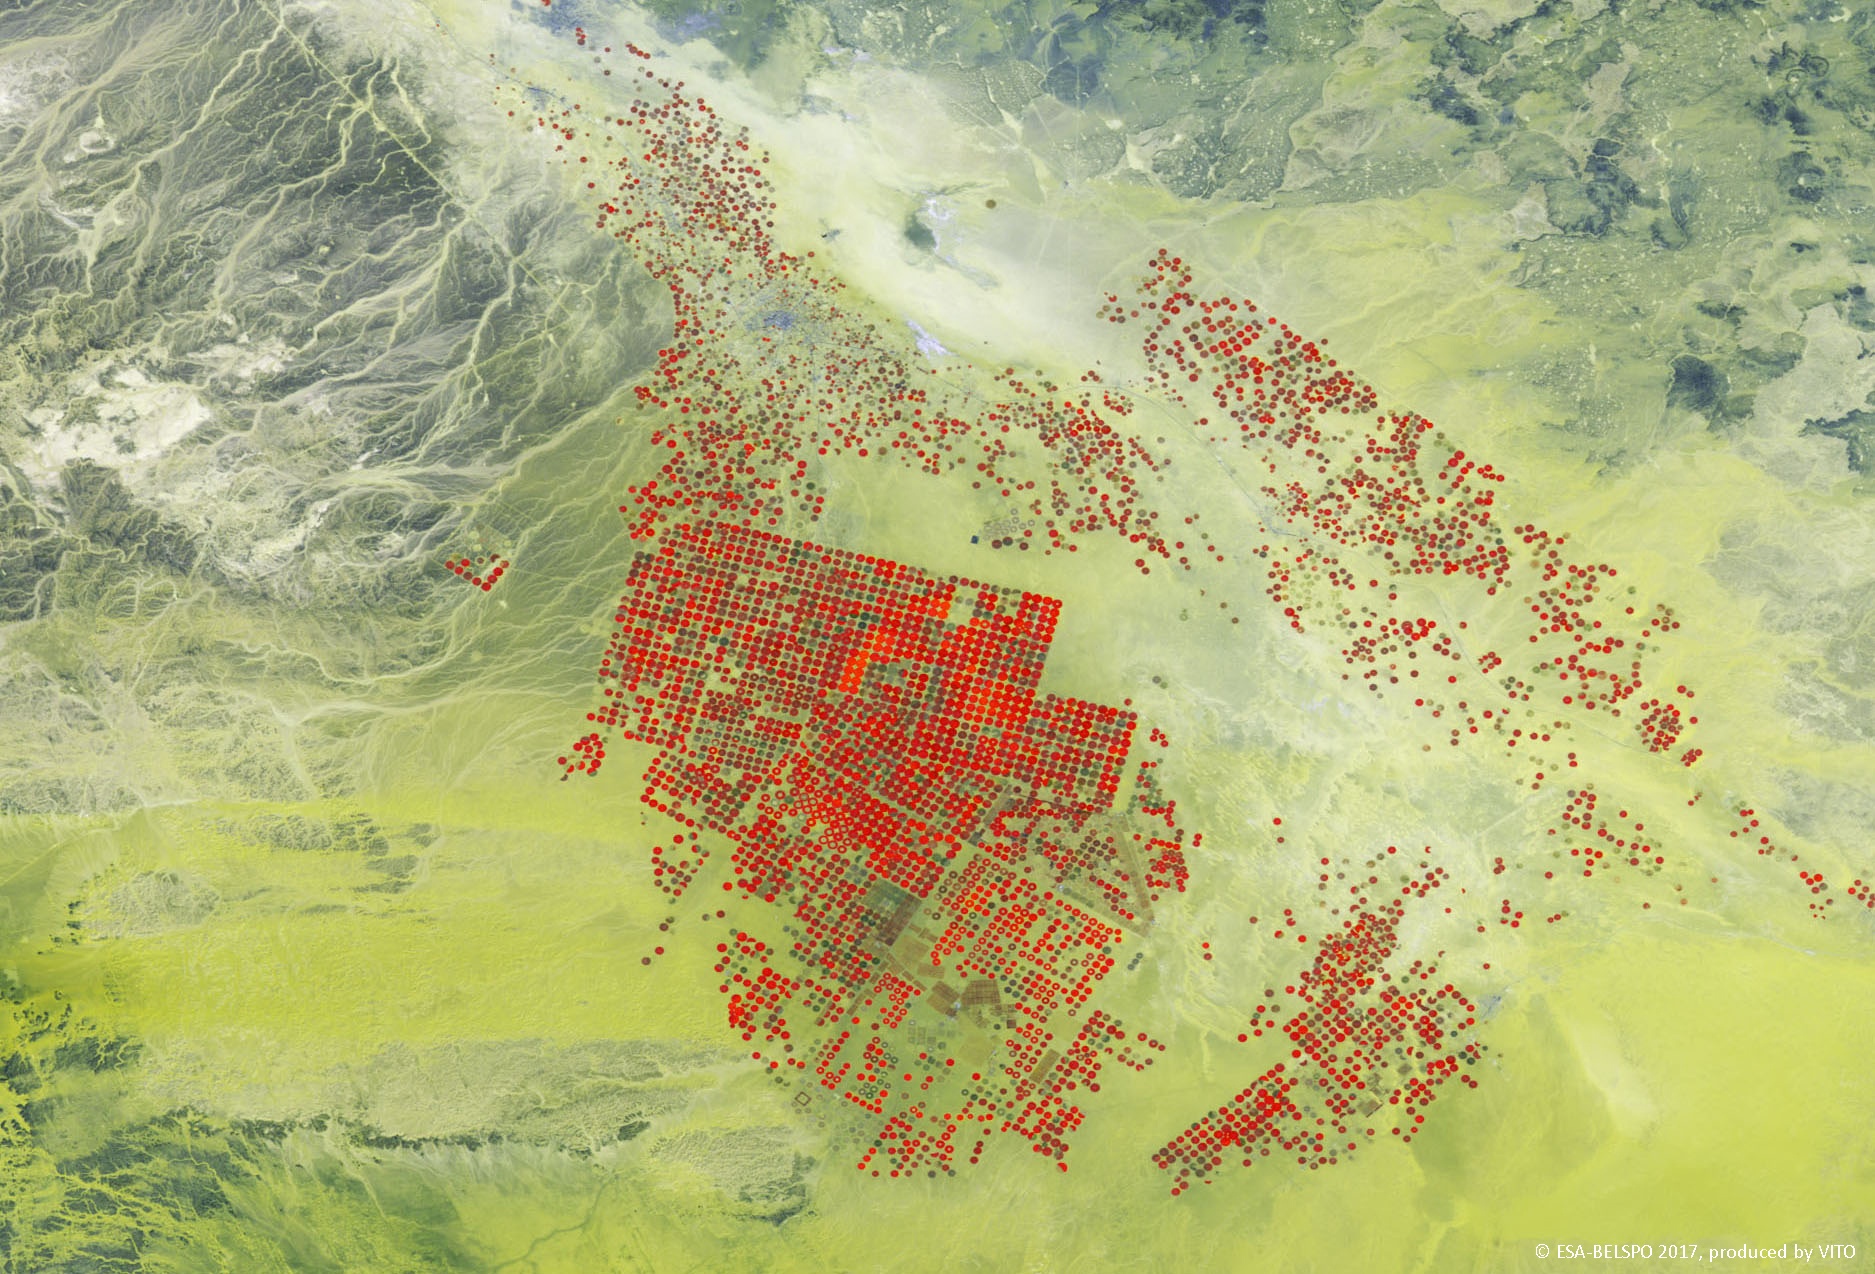
Annual Above-Ground Biomass Production (AGBP) between 2010 and 2016 at 250 m resolution, over pivot irrigation schemes in Saudi-Arabia. The annual differences in productivity can clearly be seen, as well as the expansion of cultivated area in the North-East of the image.
A multi-scale approach
WaPOR will provide open access to a database which holds information required to derive land and water productivity. The database will consist of remote sensing data at three different levels.
- continental data (bounding box, at 250 m resolution)
- country/ river basin (yellow/blue areas, at 100 m resolution)
- irrigation scheme / sub-basin level (triangles, at 30 m resolution)

We provide the remote sensing data on precipitation, biomass production, phenology and crop cycles.
In addition, land use\land cover maps are produced, including information on irrigated/rainfed croplands as well as crop type for three crops (Maize, wheat and rice). Information on the water use of the vegetation (actual and reference evapotranspiration) ) and the 30 m resolution data is provided by the partner eLEAF from Wageningen. With these variables, the water productivity can be derived.

Cropland classification around the Sous-river in Southern Morocco. The 100 m cropland classification is from the recently released Copernicus Global Land Cover Map, while an additional irrigation labelling has been performed for WaPOR. In the next release, crop types will be added as well.
Credit background image: Google
Credit background image: Google

/Blog_WorldCereal_1200x650.png)
/lewis-latham-0huRqQjz81A-unsplash.jpg)
/background_image_blog.jpg)