Processing Sentinel-1 and Sentinel-2 yearly archives
The Copernicus Sentinel-1 and Sentinel-2 satellites capture our earth's surface with high temporal frequency. Monitoring our globe since 2014 and 2015, they provide several petabytes of images annually. An enormous amount of raw data that can provide insights into the state of Earth's surface and enables research of human impact and climate change at an unprecedented level. But processing this vast volume of raw data into analysis ready data (ARD), suitable for downstream applications, presents significant challenges.
Running the pre-processing workflows at a global scale is technically intricate and financially demanding. Sentinel-1 for example requires radiometric calibration, terrain correction, speckle de-noising, reprojection, and mosaicking. For Sentinel-2 data, clouds screening, cleaning, reprojection, and mosaicking are needed to make the data usable for modelling.
For the development of WorldCover 2020 and 2021, the first global land cover maps at 10 meters resolution based on Sentinel-1 and Sentinel-2 data, prepared in the framework of the European Space Agency WorldCover project, we ran these workflows at scale to process and produce a set of annual 10 m temporal composites for the years 2020 and 2021.
After the release of the WorldCover products, many users expressed their interest and requested access to these composites. We therefore decided to share the WorldCover Sentinel-1 and Sentinel-2 annual composites for public use. These mosaics are interesting to kickstart several projects without the daunting task and costs of processing extensive amounts of data.
WorldCover annual composites
The WorldCover annual composites are derived from the yearly collections of Sentinel-1 and Sentinel-2 data. Users can easily integrate the layers into their workflows and seamlessly build applications on top of them.
The following collections are available for both 2020 and 2021.
- Sentinel-2 RGBNIR median composite:
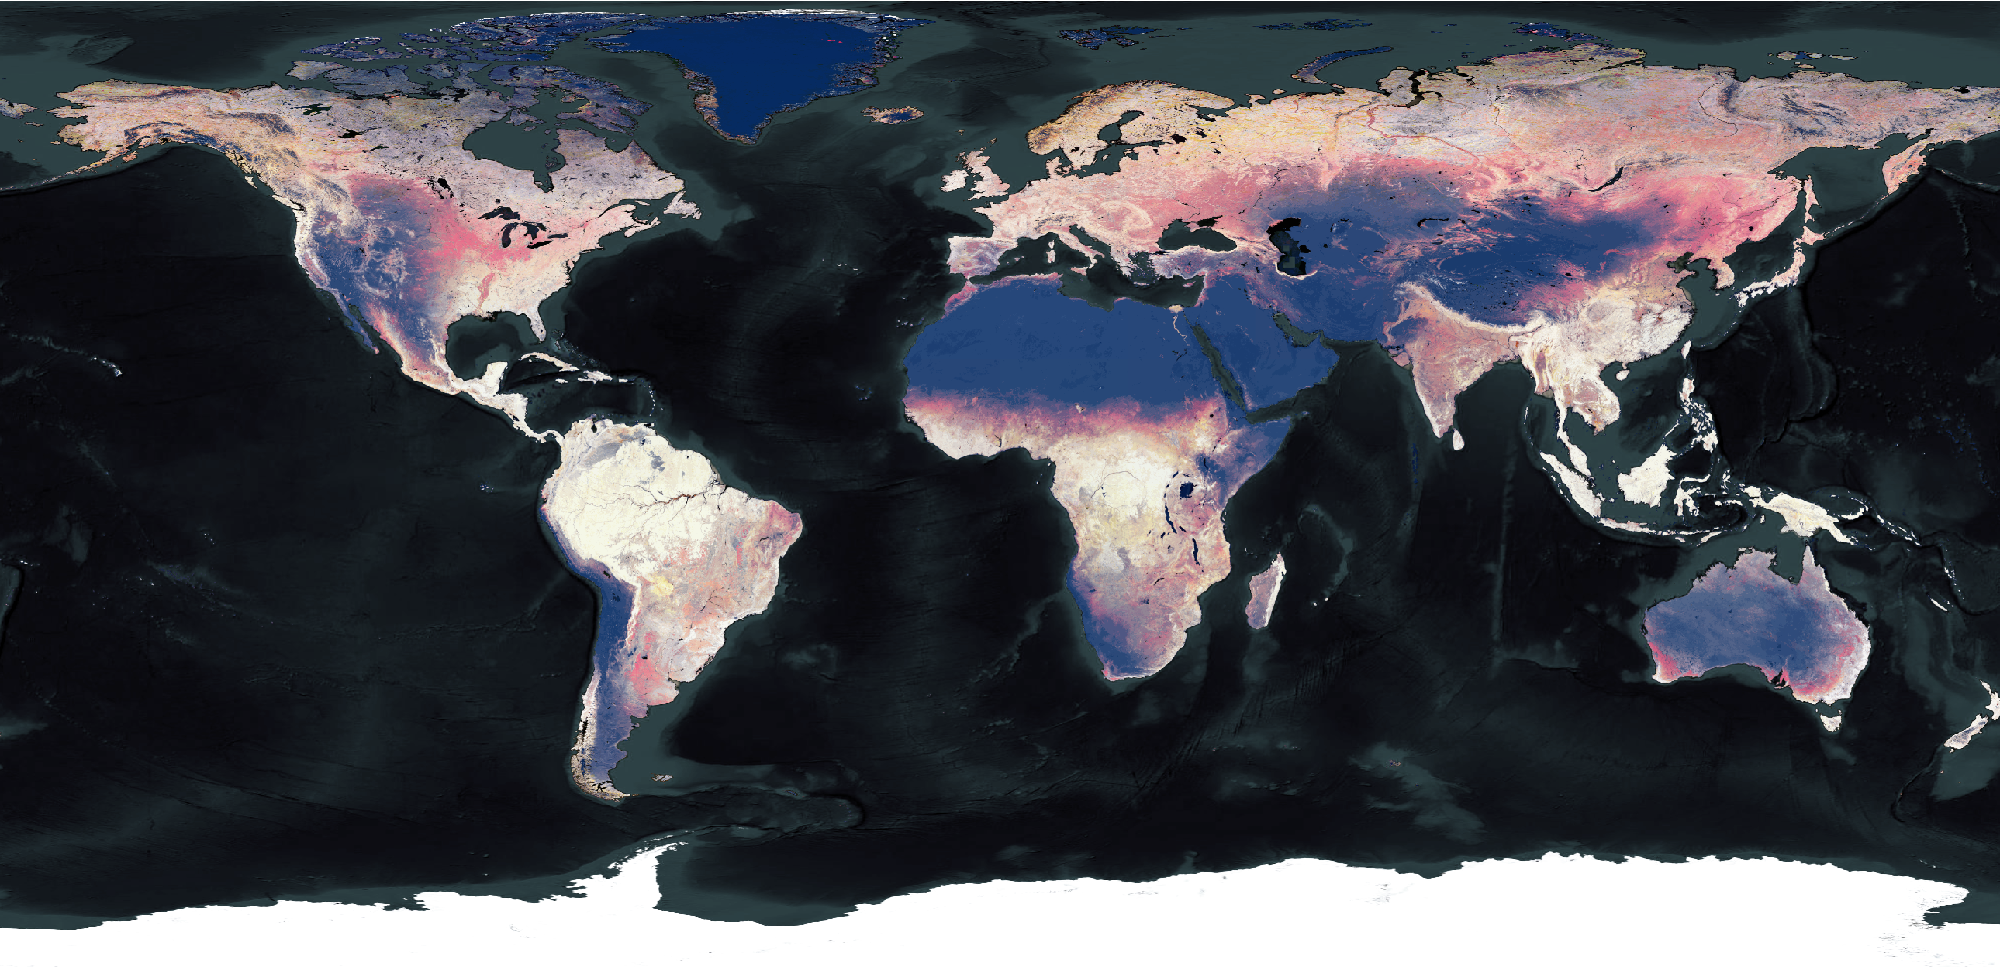
B02, B03, B04, B08 yearly median. Sentinel-2 cloud-free composite of the optical and near-infrared bands. The figures below show an RGB composite (B04, B03, B02) and a FALSE COLOR composite (B08, B04, B03) obtained by combining the bands of this product.
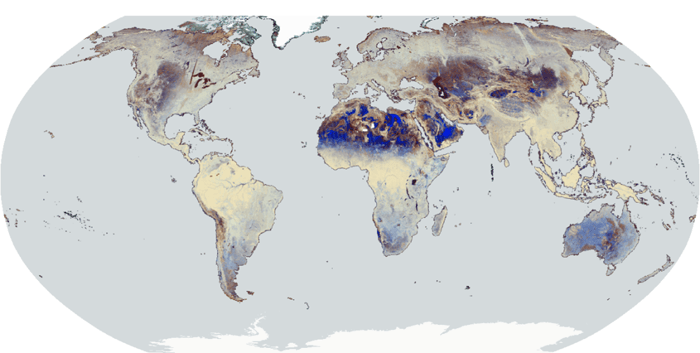
- Sentinel-2 SWIR median composite:
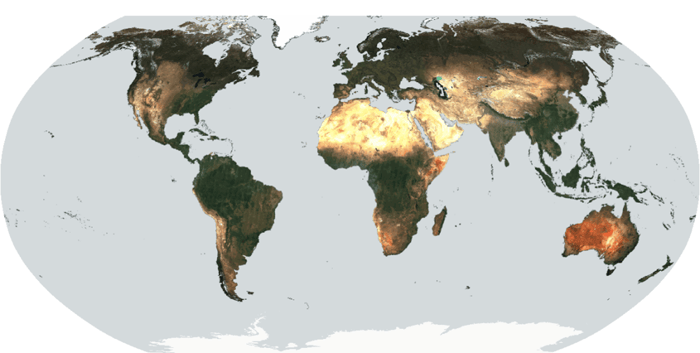
B11, B12 yearly median. 20m SWIR bands, which offer additional information for the mapping of water and vegetation. In the visualization below, an RGB composite is obtained by stacking B12 (red), B11 (green) and B12 (blue). Vegetation appears green, water and wet soil are black or dark, while bare and dry soil are bright.
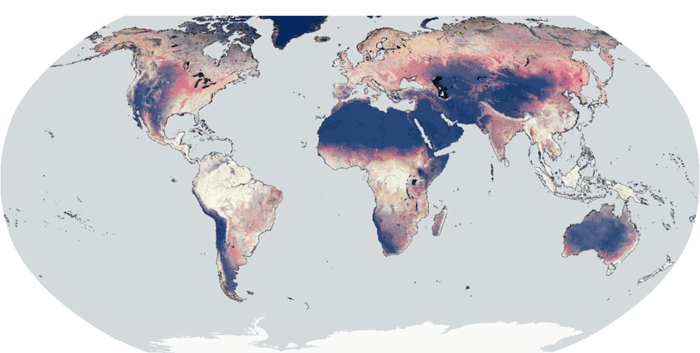
- Sentinel-2 NDVI percentiles composite:
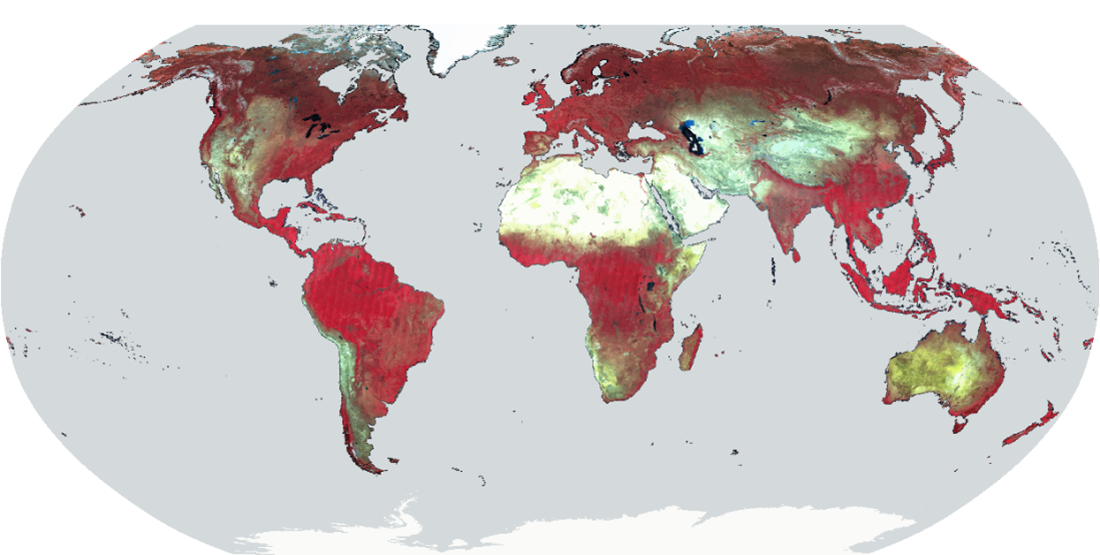
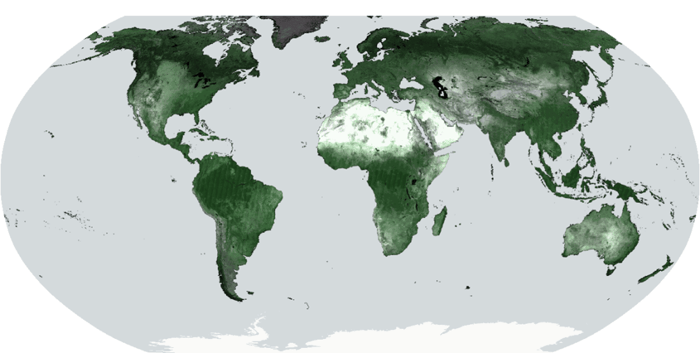
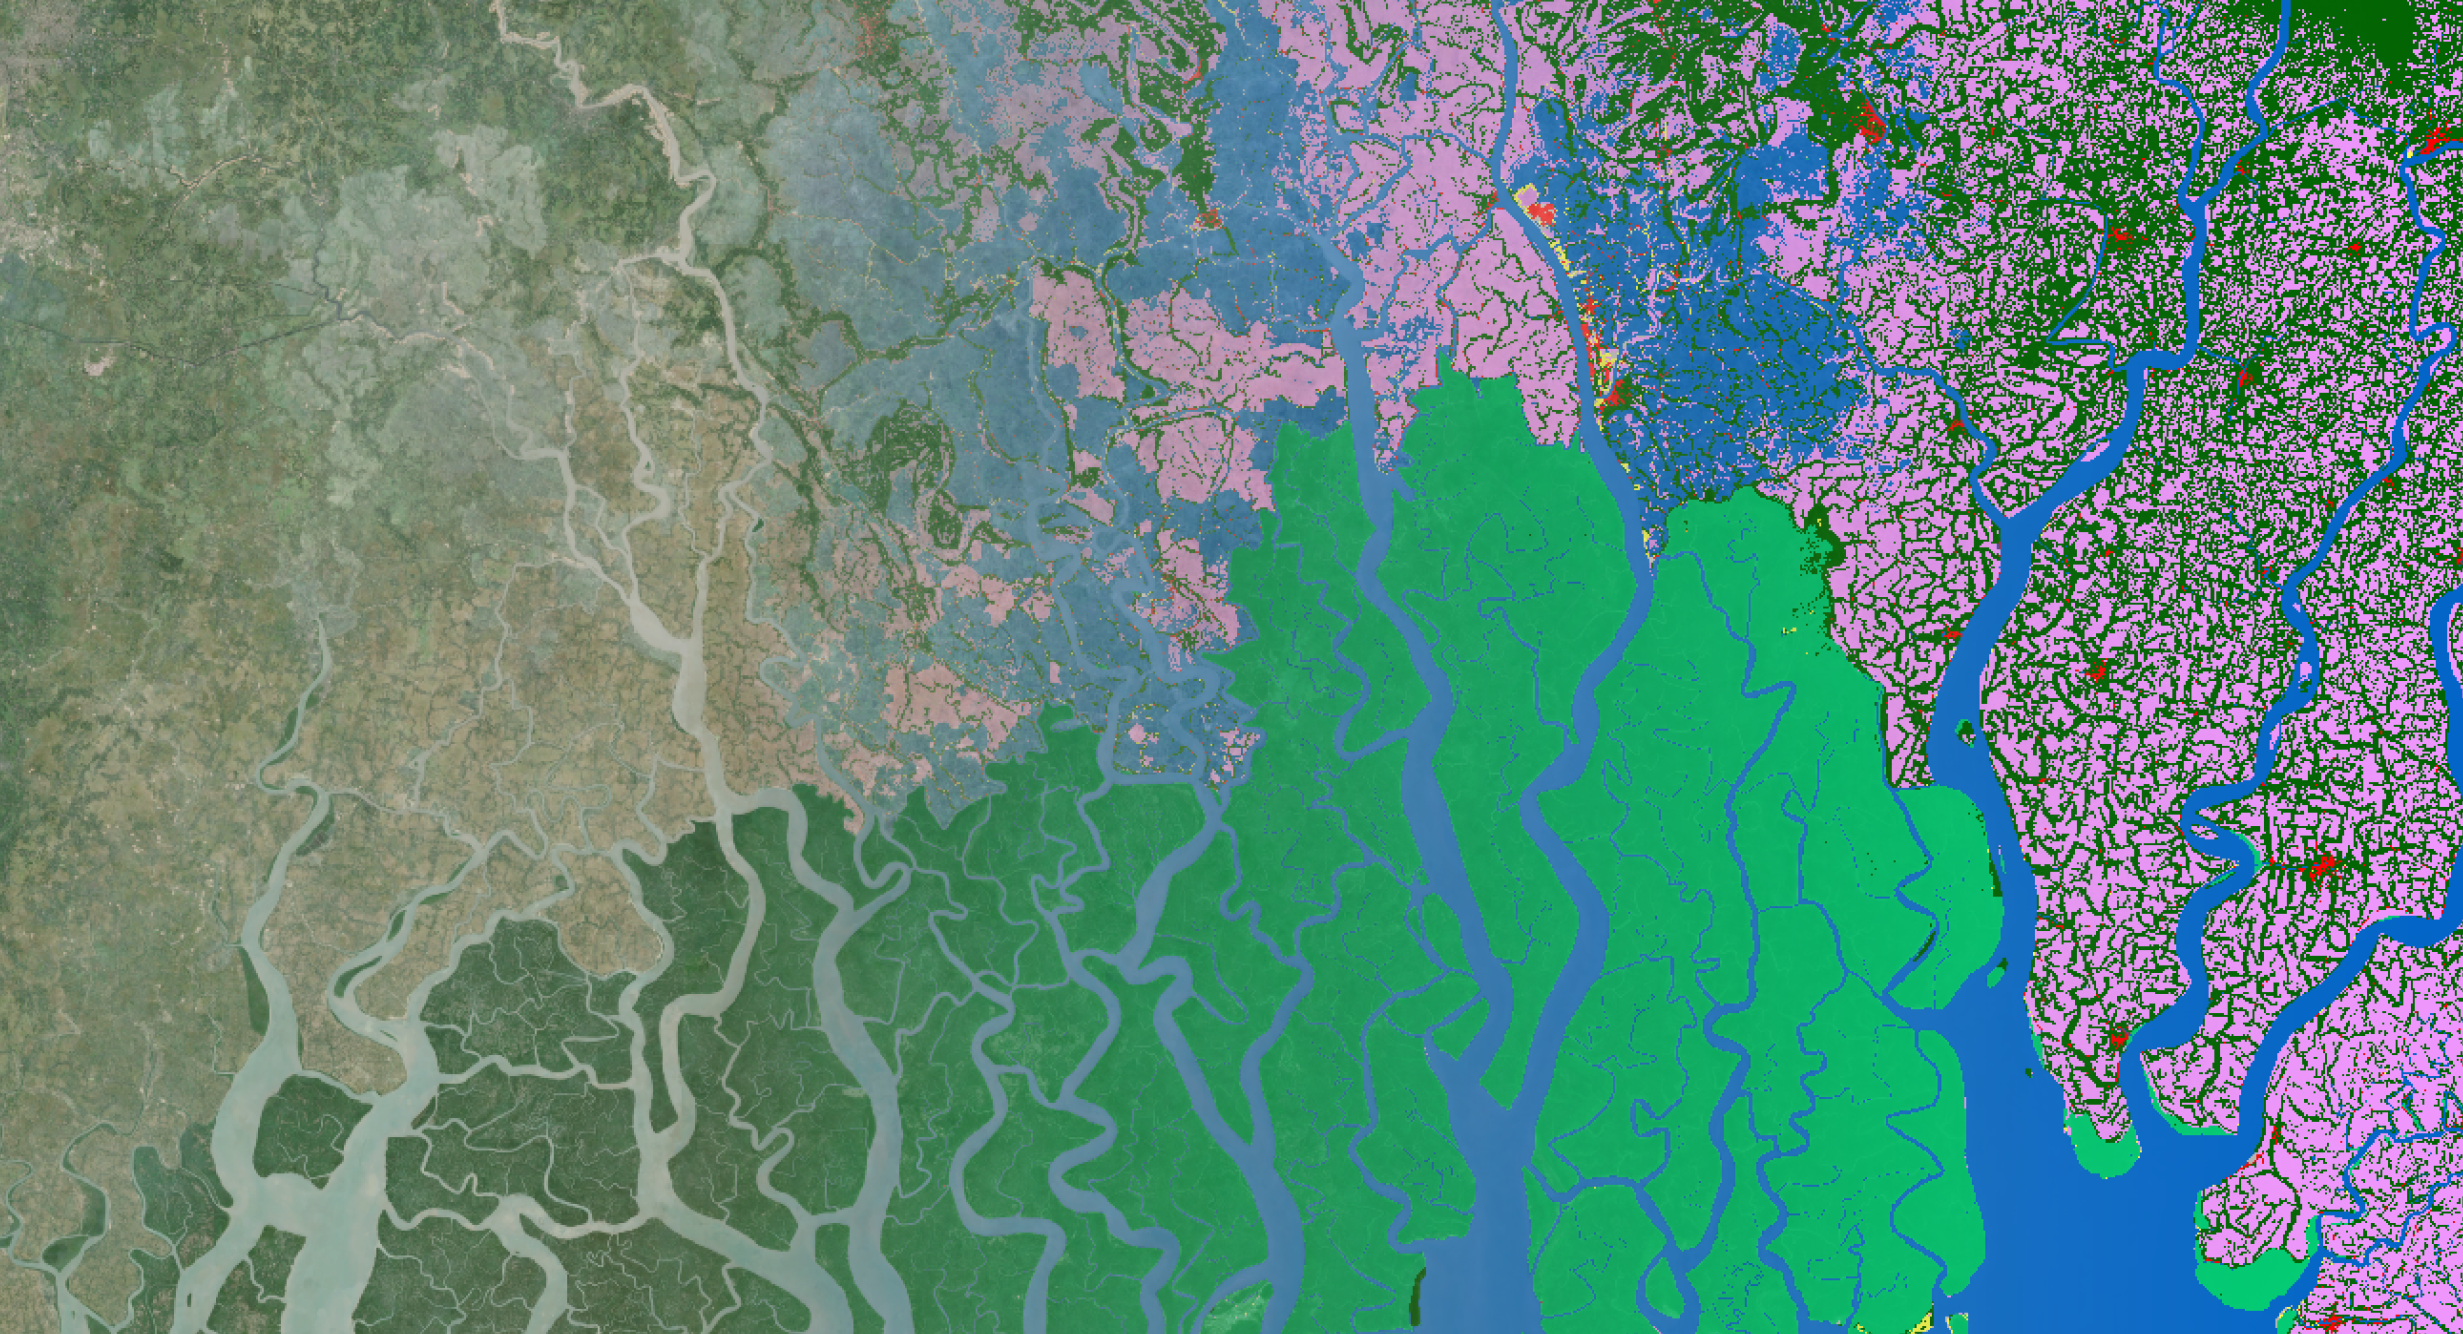
NDVI 90th percentile, NDVI median, NDVI 10th percentile. These percentiles allow to represent yearly phenological information in an RGB composite. Typically, bare/sparsely vegetated areas will show as dark pixels as they have low NDVI throughout the year. Bright pixels on the other hand, represent evergreen vegetation, which shows high NDVI constantly. In between, areas which are partially vegetated during the year will show a range of colours going from yellow to red. This is because they can have a high NDVI in the vegetated period and a low NDVI value in the non-vegetated one. This is also typical of croplands for example, which mostly appear pink/red in the map below.
- Sentinel-1 GAMMA0 median composite:
3 bands, VV median, VH median, VH/VV median, Radiometric Terrain Corrected SAR Backscatter, power scaled. This composite is particularly useful for mapping of water and settlements or to discriminate different types of vegetations. In general, a radar signal is particularly important, because the surface morphology affects the backscattered signal, providing further information that cannot be accessed by optical satellites.
Data access
The collections are available on Terrascope and the AWS Open Data Registry, and can be inspected and compared on the WorldCover Viewer. WMS layers are also available from the Terrascope WMS service. More information about the collections and layers is available on the WorldCover website.
The products are available free of charge for all users. The Sentinel-1 and Sentinel-2 composites are accessible on the public AWS buckets (eu-central-1 region) s3://esa-worldcover-s1 and s3://esa-worldcover-s2 respectively.
A grid of the products is provided here. This FlatGeobuf file can be opened remotely in QGIS or python and can be used to retrieve the S3 paths (or URL links) of the desired tiles.
Each product is delivered as a series of Cloud-Optimized GeoTIFFs (COGs) in WSG84 projection in a grid of 1 by 1 degrees and at approximately 10m resolution, except for the SWIR composite which is provided at 20m resolution. (Actual resolution in degrees is provided in the metadata table). The Sentinel-2 composites were produced from the L2A archive. The GAMMA0 composite was produced by pre-processing the Sentinel-1 GRD products using GAMMA software. More information about the products generation and pre-processing steps is available in the WorldCover V200 Product User Manual.
| Product | Bands | Values Range | Nodata | Offset | Scale | Type | Pixel Size (deg) | Size (TB/year) |
| RGBNIR | 4 | 0 - 10000 | 0 | 0 | 0.0001 | uint16 | 0.0000834 | 8.5 TB |
| SWIR | 2 | 0 - 250 | 255 | 0 | 0.004 | uint8 | 0.000167 | 0.6 TB |
| NDVI | 3 | 0 - 250 | 25 | -1 | 0.008 | uint8 | 0.0000834 | 3.1 TB |
| GAMMA0 | 3 | 0 - 65535 | 0 | -45 | 0.001 | uint16 | 0.0000834 | 6.3 TB |
A whole range of possibilities
These layers can serve users for a series of diverse applications that aim to monitor properties of the surface on a yearly basis or detect inter annual changes. Here are a few examples showcasing the potential of these layers.
- Yearly Land Cover and Land Use
The composites are particularly interesting to map different land cover or land use classes. WorldCover is an example of such a product, but this can be expanded to any type of class for which the user is able to collect annotations.
Below is an example of maps generated for 2020 and 2021 over the Toshka lakes in Egypt. During 2020 the lakes water capacity was extended, and this can be observed in the 2021 map.
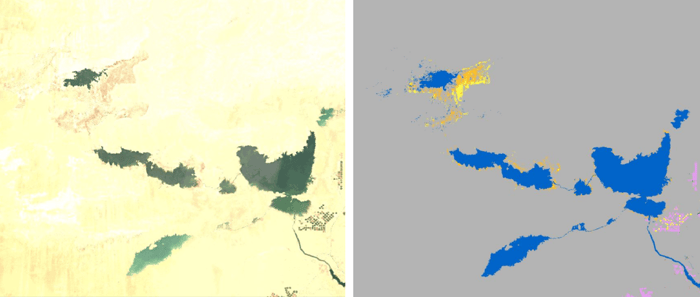
WorldCover RGB yearly median composite for 2020 (left) and WorldCover 2020 map (right) over the Toshka lakes, Egypt. Explore in the WorldCover viewer.
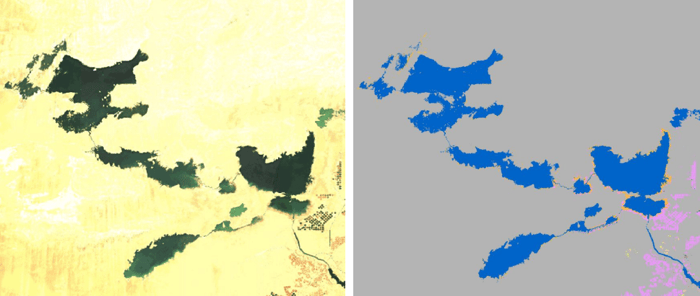
WorldCover RGB yearly median composite for 2021 (left) and WorldCover 2021 map (right) over the Toshka lakes, Egypt. Explore in the WorldCover viewer
- Palm Oil Plantations
Palm oil plantations are known to have destructive impact on biodiversity and ecosystems. The rapid expansion of these plantations leads to deforestation, causing the loss of critical habitats for numerous species. Mapping extension of palm oil plantations is important in monitoring certain habitats health.
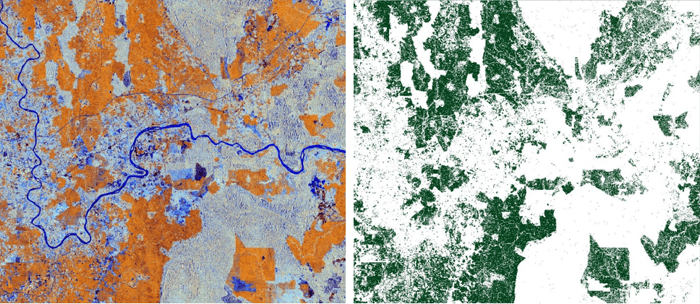
WorldCover GAMMA0 composite (left) highlights palm oil plantations in Malaysia. Derived map of the plantations (right). Explore in the WorldCover viewer.
- Forest Fires
Another potential application is the detection of changes between different years, enabling the detection of e.g., forest fires. You can perform a quantitative measure of the extension of the fires in a straightforward manner.
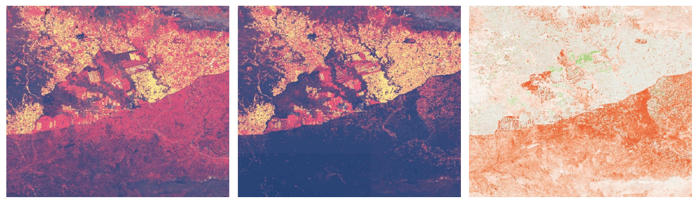
WorldCover NDVI yearly percentiles composite for 2020 (left) and 2021 (centre) over the August complex fire near Sacramento. NDVI 90th percentile difference (right) between 2020 and 2021, highlighting the fire occurring in August 2020 over the area. Explore in the WorldCover viewer.
- Vegetation Changes
Another example of a decreased vegetation can be observed over the border between Syria/Iraq and Turkey. A severe drought hit the area at the end of 2020. Turkey’s infrastructure was apparently able to compensate for the lack of rain, while in Syria and Iraq a drastic decrease of the agricultural activity can be observed on the border. Iraq’s government estimated a decrease of 50% of farmland for the 2021-2022 seasons.
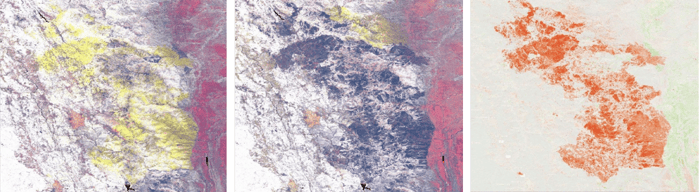
WorldCover NDVI yearly percentiles composite for 2020 (left) and 2021 (centre) over the eastern part of the Syrian-Turkish border. NDVI 90th percentile difference (right) between 2020 and 2021, highlighting the decreased agricultural activity in Syria and Iraq following the severe drought that started at the end of 2020. Explore in the WorldCover viewer.
With the release of the WorldCover annual composites, we aim to broaden the use of the WorldCover products and provide the Earth Observation community with an exciting new ARD dataset. The showcased examples only provide a glimpse into the vast potential offered, but we are confident that many existing and new users will recognize the value and ease of use of these layers. This, in turn, will unlock the development of new services and applications, contributing to the collective efforts to monitor and safeguard the health of our planet.
-------------------------
These layers were produced as a side product of the ESA WorldCover project. For the full license information see the Creative Commons Attribution 4.0 International License. Publications, models and data products that make use of these datasets must include proper acknowledgement, including citing the datasets and the journal article as in the following citation.
Zanaga, D., Van De Kerchove, R., Daems, D., De Keersmaecker, W., Brockmann, C., Kirches, G., Wevers, J., Cartus, O., Santoro, M., Fritz, S., Lesiv, M., Herold, M., Tsendbazar, N.E., Xu, P., Ramoino, F., Arino, O., 2022. ESA WorldCover 10 m 2021 v200. https://doi.org/10.5281/zenodo.7254221
Disclaimer and known limitations:
Certain areas are affected by artefacts deriving by lack of input products, the presence of corrupted input products and/or improperly filtered cloudy and snowy products. These artefacts could only be observed after producing the global products and could not be addressed in the current version. Before running their analysis, users should take the necessary precautions and assess that their research area is not affected by these artefacts.

/lewis-latham-0huRqQjz81A-unsplash.jpg)
/boudewijn-huysmans-_iyh6g5KHQA-unsplash.jpg)