A key achievement of this project is that users get access to our large processing cluster from a web UI where you can simply paste your Python code. Common steps like finding products are integrated, so that you can focus on your problem. Scheduling the same workflow as new products become available is now also easier, and the end result of your work can be shared and exposed as a web service, so that others can use your work.
Today algorithm providers want to focus on domain specific research and are less willing to spend resources on installing and operating large IT infrastructure when processing EO data.
Hande Erdem, Big Data Project Manager
VISION & Strategy
The PROBA-V MEP and Terrascope earth observation platforms are relatively small compared to the big cloud players. This also poses limits on the volume of Copernicus data we can offer, just like other European providers. Hence we are working together within the European earth observation ecosystem to build a federation of platforms that uses standards to offer a similar experience as those bigger players. The question here will be whether we can turn the diversity and smaller scale of European institutes and enterprises into a benefit that results in more resilience, competitiviness and transparancy. And of course, the user of earth observation data will want the best possible experience!
What algorithm providers want, in fact, is an easy way to deploy and share their algorithms.
With this project, we have taken one small step in this larger vision. At the same time, we're working in the ESA openEO platform (https://openeo.org/platform/) project on a standard that takes a different, and in some ways complementary approach. By doing this, we try to accomodate different use cases, and give the user freedom of choice to find something that works. We already provided infrastructure as a service with 'user VM's' on our OpenStack cloud, a large Hadoop processing cluster, and now also two 'Platform as a service' available as public beta: openEO and ASB. Connecting these services with others to build a European ecosystem that can support digital twins is the goal of the 'Destination Earth' initiative that contributes to the European Commission’s Green Deal and Digital Strategy. At VITO, we believe our end-to-end experience from operating cloud platforms to the data science that tries to model processes on earth, will contribute to the necessary next steps in these ambitious plans.
Automated service builder (ASB)
![]()
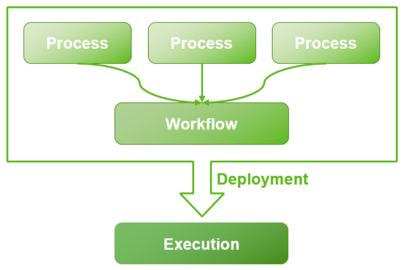
In this project, we teamed up with Space Applications, an independent company that is also based in Belgium. Their ASB framework, which offers a "low coding" solution for implementing complex processing chains, has been instrumental in working towards our goal. By using, users can import their custom algorithms and include them in workflows as a process. At execution time, the algorithms are automatically deployed and executed. These processes can be shared with other users easily.
The ASB system has also been deployed on DIAS in the frame of the EOpen H2020 project (https://eopen-project.eu/). Hence users already familiar with this interface, will now find it easier to also use the PROBA-V MEP and Terrascope infrastructure.
FIELD DELINEATION
During the course of the project, we deployed couple of example services using ASB which were originally developed by VITO Remote Sensing Applications team. One of these services was the "Field Delineation", detecting field boundaries in an automatic way using machine learning. Field boundaries are susceptible to change in each growing season. Sometimes neighbouring parcels are joined, or a single large parcel is subdivided. This makes it relatively hard to maintain an up-to-date database of all fields, and even if this information exists, it is not always accessible.
The agricultural landscape is mapped by an automatic detection and delineation of agricultural parcels using Sentinel-2 L2A data and a trained fully-convolutional neural network, an approach which has already proven to be highly successful and efficient at the country-scale. The resulting high-resolution cropland mask can be used as an input for further analysis.
This algorithm is designed to run efficiently in an ‘on-demand’ manner, on user defined areas of limited size. The neural network needs to be trained and validated for specific regions, so it will only be allowed to run on those regions.
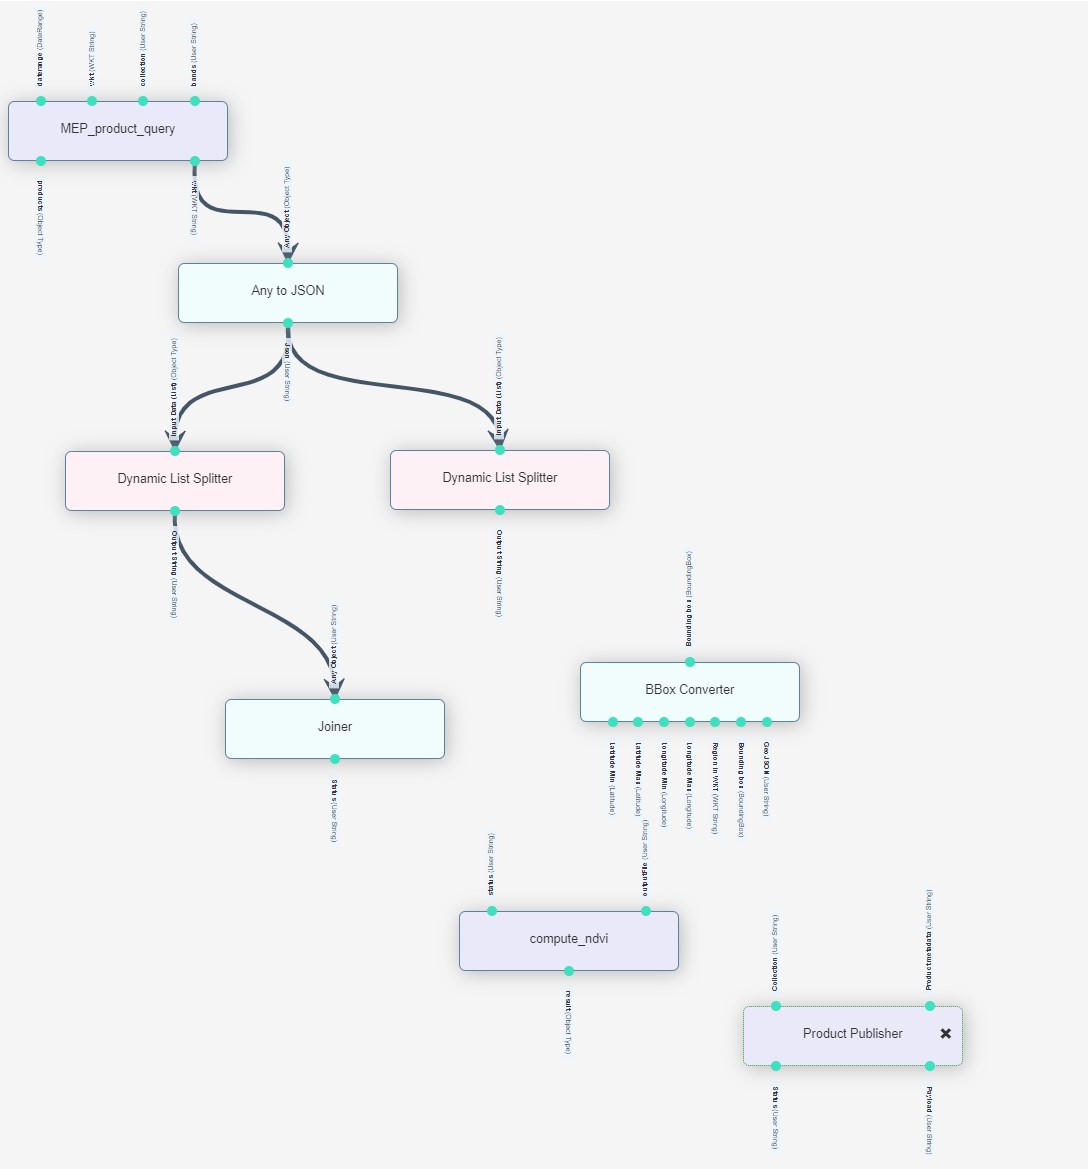
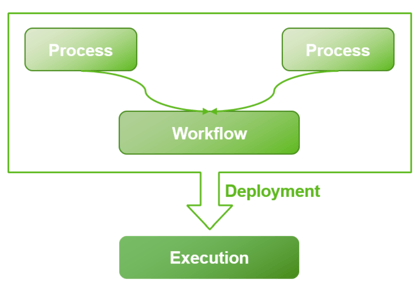
The actual implementation of the use case on ASB consisted of creating three processes and a workflow, main goal being, based on satellite imagery, to obtain the vector representation of field over a given region.
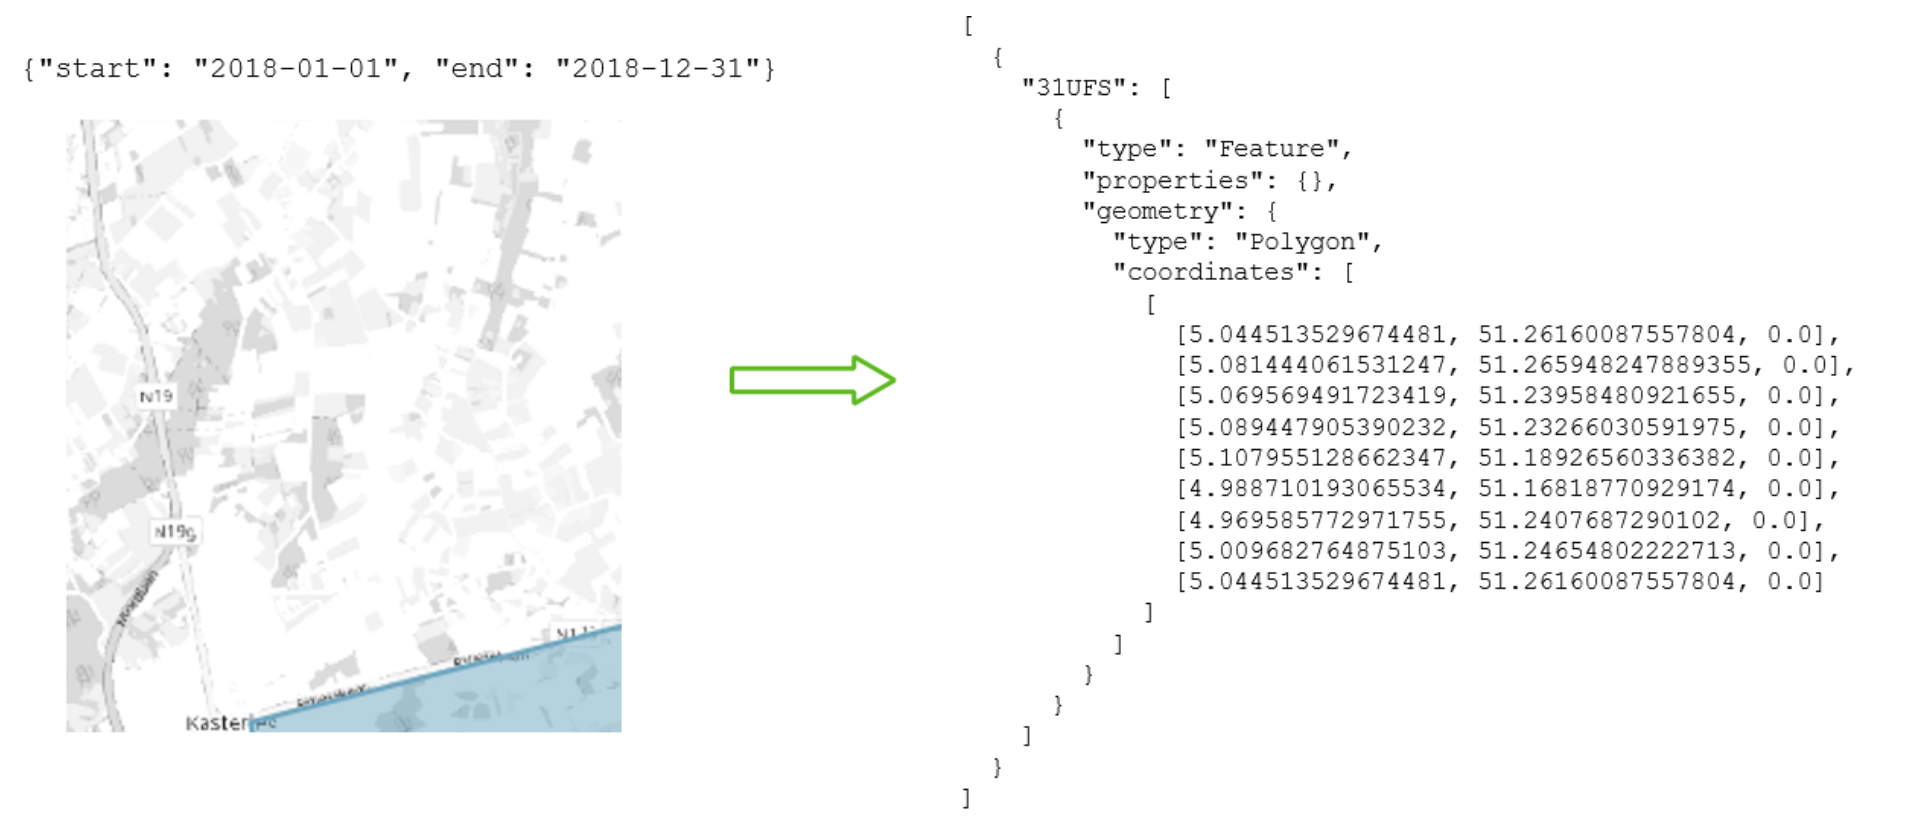
First process obtains the tile identifiers and corresponding parts of the region spanning over a particular tile for a given start-end date.
The second process identifies the fields using the trained convolutional neural network which is then passed onto the third process for building the vector representation of the identified fields. All these three processes are tied together using an ASB workflow. The result of the workflow in this case is a text file.
CROP PHENOLOGY
A very important use case for higher resolution Copernicus data (Sentinel 1 / Sentinel 2) is determining the phenological stage of the crops on a given parcel. This is not only useful for farming applications, but also for instance to support Europe’s common agricultural policy (CAP). By introducing the use of Sentinel 1 data, we reduce the effect of clouds. As such we propose a modern multi-sensor data fusion approach for to solve this problem.
Based on a field delineation or existing field database, phenological parameters such as start of season, end of season and season max will be determined on the field level. As input this use case extracts aggregated time series per field from the PROBA-V MEP time series service. Required input data is the Sentinel-2 fAPAR, and Sentinel-1 VV and VH backscatter intensity as well as the radar vegetation index. The resulting service allows creating a vector map with phenological parameters. It can invoke the workflow created in use case 1 to generate the field delineation.
In order to implement this use case on ASB, we created a workflow and two processes:
The first process obtains the fAPAR time series using an OpenEO service:
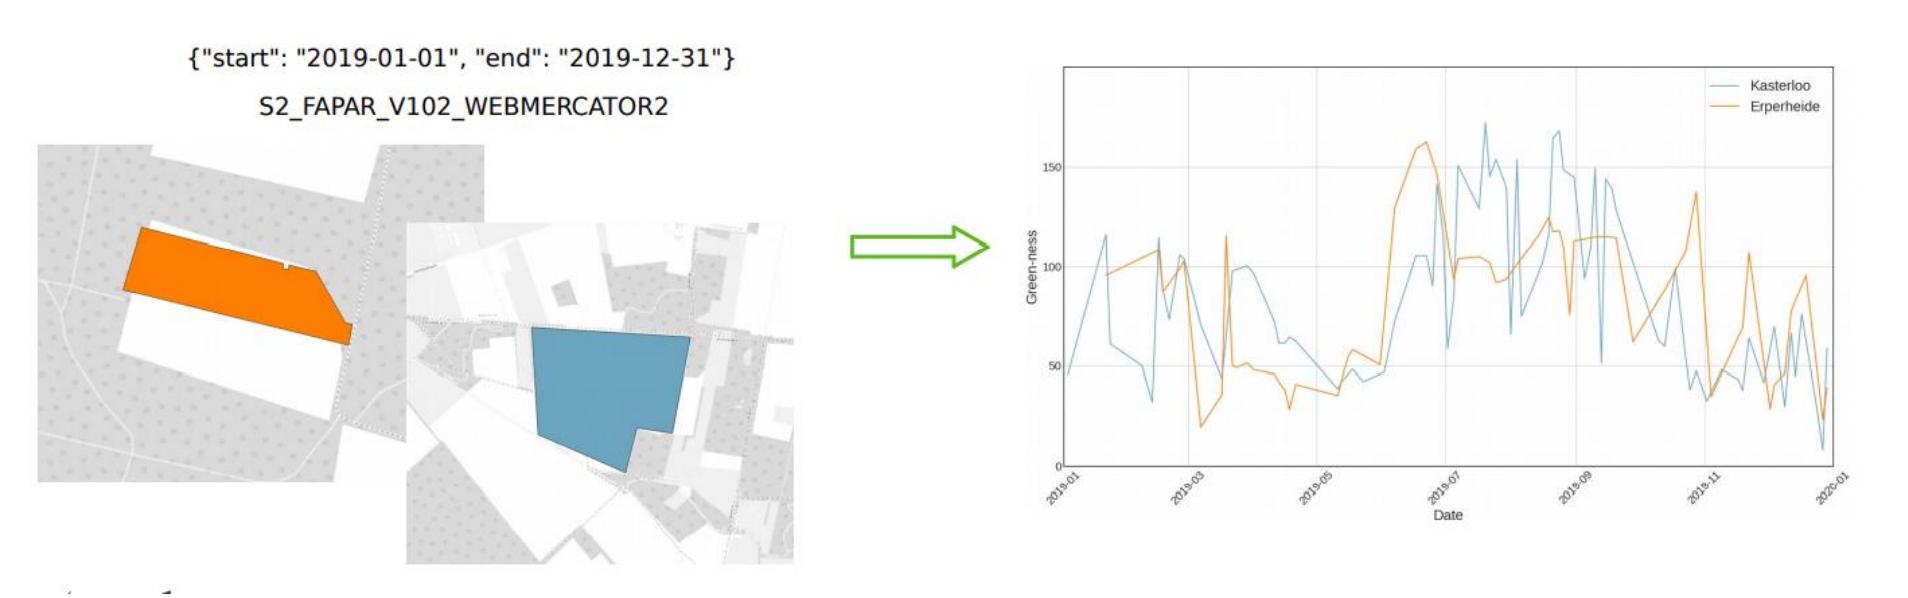
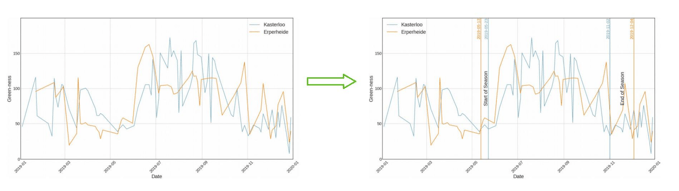
The second process applies the phenology algorithm to determine season parameters. The end result of the workflow is a JSON file containing start and end of season dates for a given field.
GETTING STARTED WITH ASB
We prepared a video tutorial for you along with the necessary source code to get you started on the ASB. You can find this material on https://github.com/VITObelgium/asb-usecases.
To try this new system yourself, check out the toolset of the PROBA-V MEP website (https://proba-v-mep.esa.int/), or directly through this link: https://mep-wps.vgt.vito.be.
We make this available to you as a public beta, to gather feedback from the community so it can be further improved and used in production use cases. Make sure to let us know your feedback!