Global orbit, local use
Meet Sentinel-2, an ESA satellite launched in 2015 capable of delivering both high spatial resolution (10m) images as well as large coverage (290km swath). Its data gives us an unprecedented view of the river network in Flanders, allowing us to monitor variability in water and land surface conditions including:
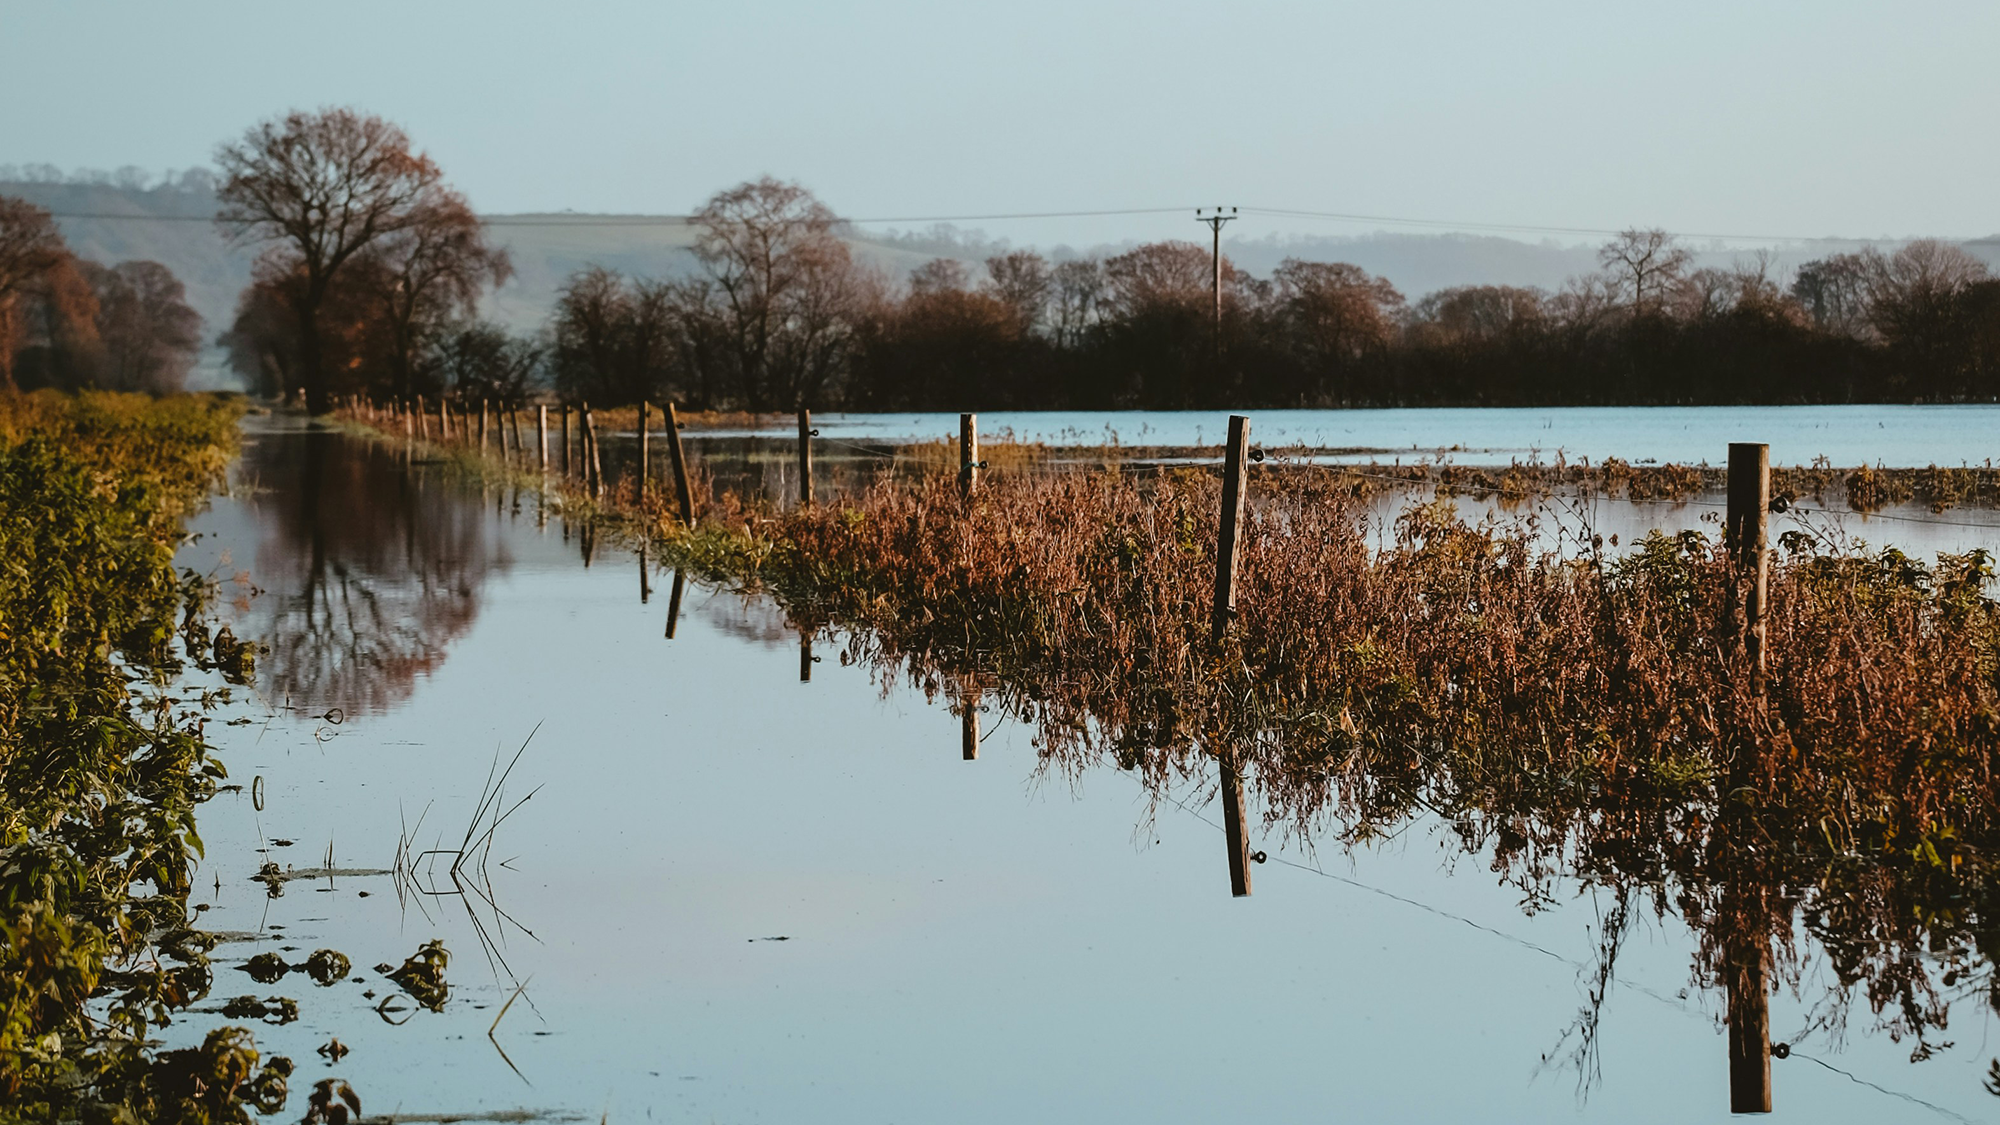
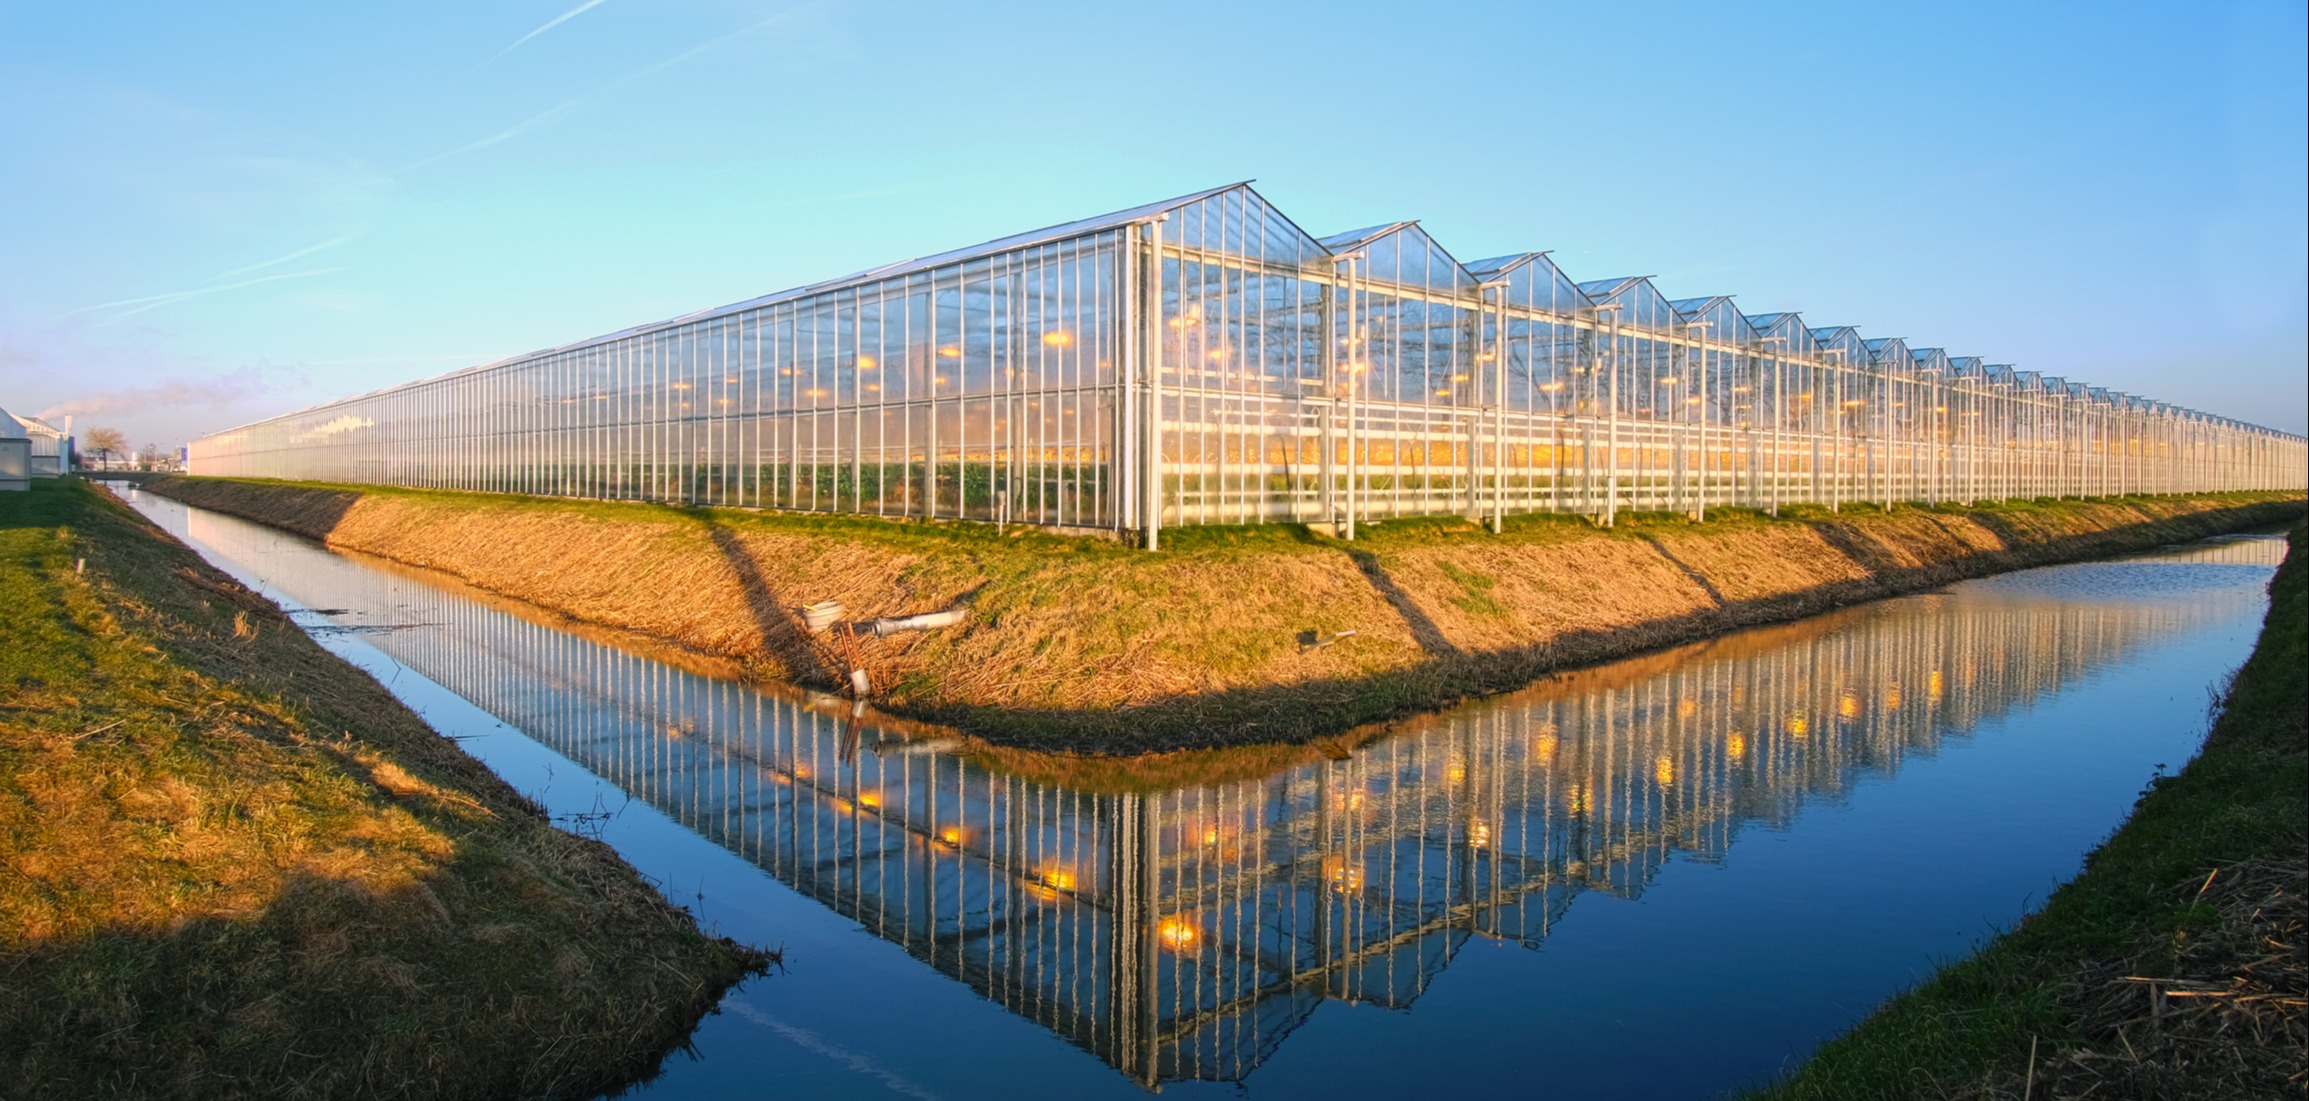
- Vegetation
- Agriculture
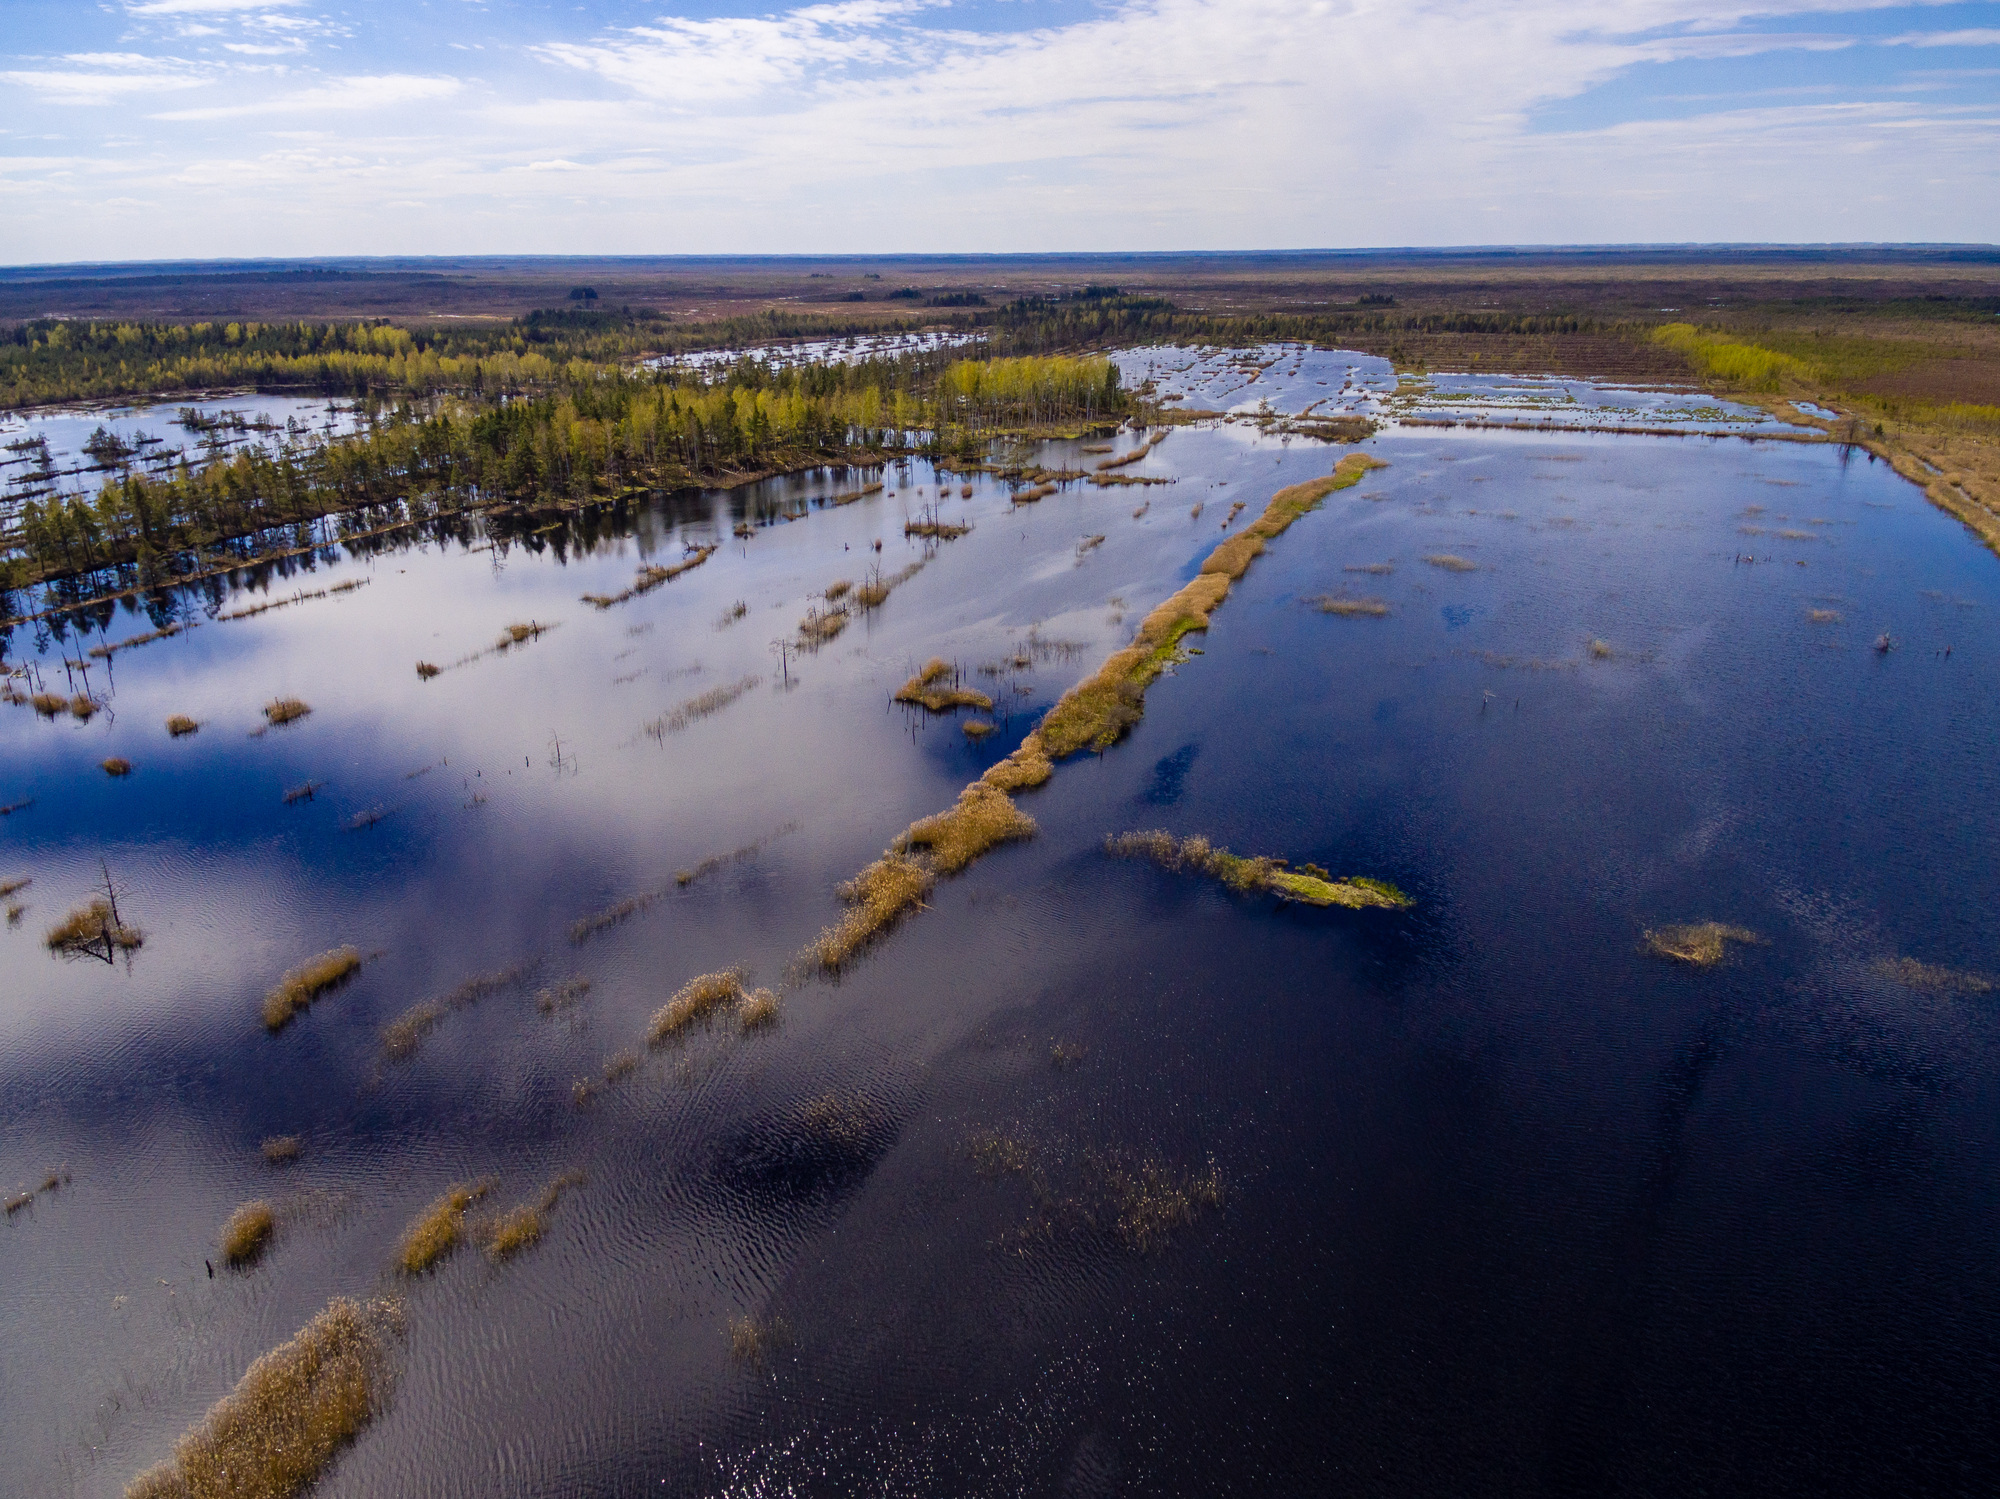
- Inland waterways
- Coastal areas
Satellite data for suspended sediment mapping
Satellite data like that of the Sentinel-2 can be used for a wide variety of applications. Suspended sediment mapping is one such example, and it’s particularly important for the Flemish and harbour authorities to track and improve the sustainable management of the waterway. It helps you to easily monitor spatial variations as well as subtle shifts over time, allowing you to gauge the results of your actions.
Water management now takes clicks, not weeks
There have always been ways of measuring and modelling suspended sediment for waterway management, so what makes using satellite data so interesting? This is where our people come in. By combining the right satellite data with the necessary image processing chain we provide a snapshot of the complete river in just a few mouse clicks. Using conventional methods, it would take weeks to cover the complete area.
What’s happening behind the scenes
A snapshot in a few mouse clicks. It all sounds very easy to the end-user. As it should be. But behind those clicks lies a completely automated processing chain. It detects the presence of clouds in the image, corrects for absorption and scattering of atmospheric constituents and – of course – derives the suspended sediments in the river.
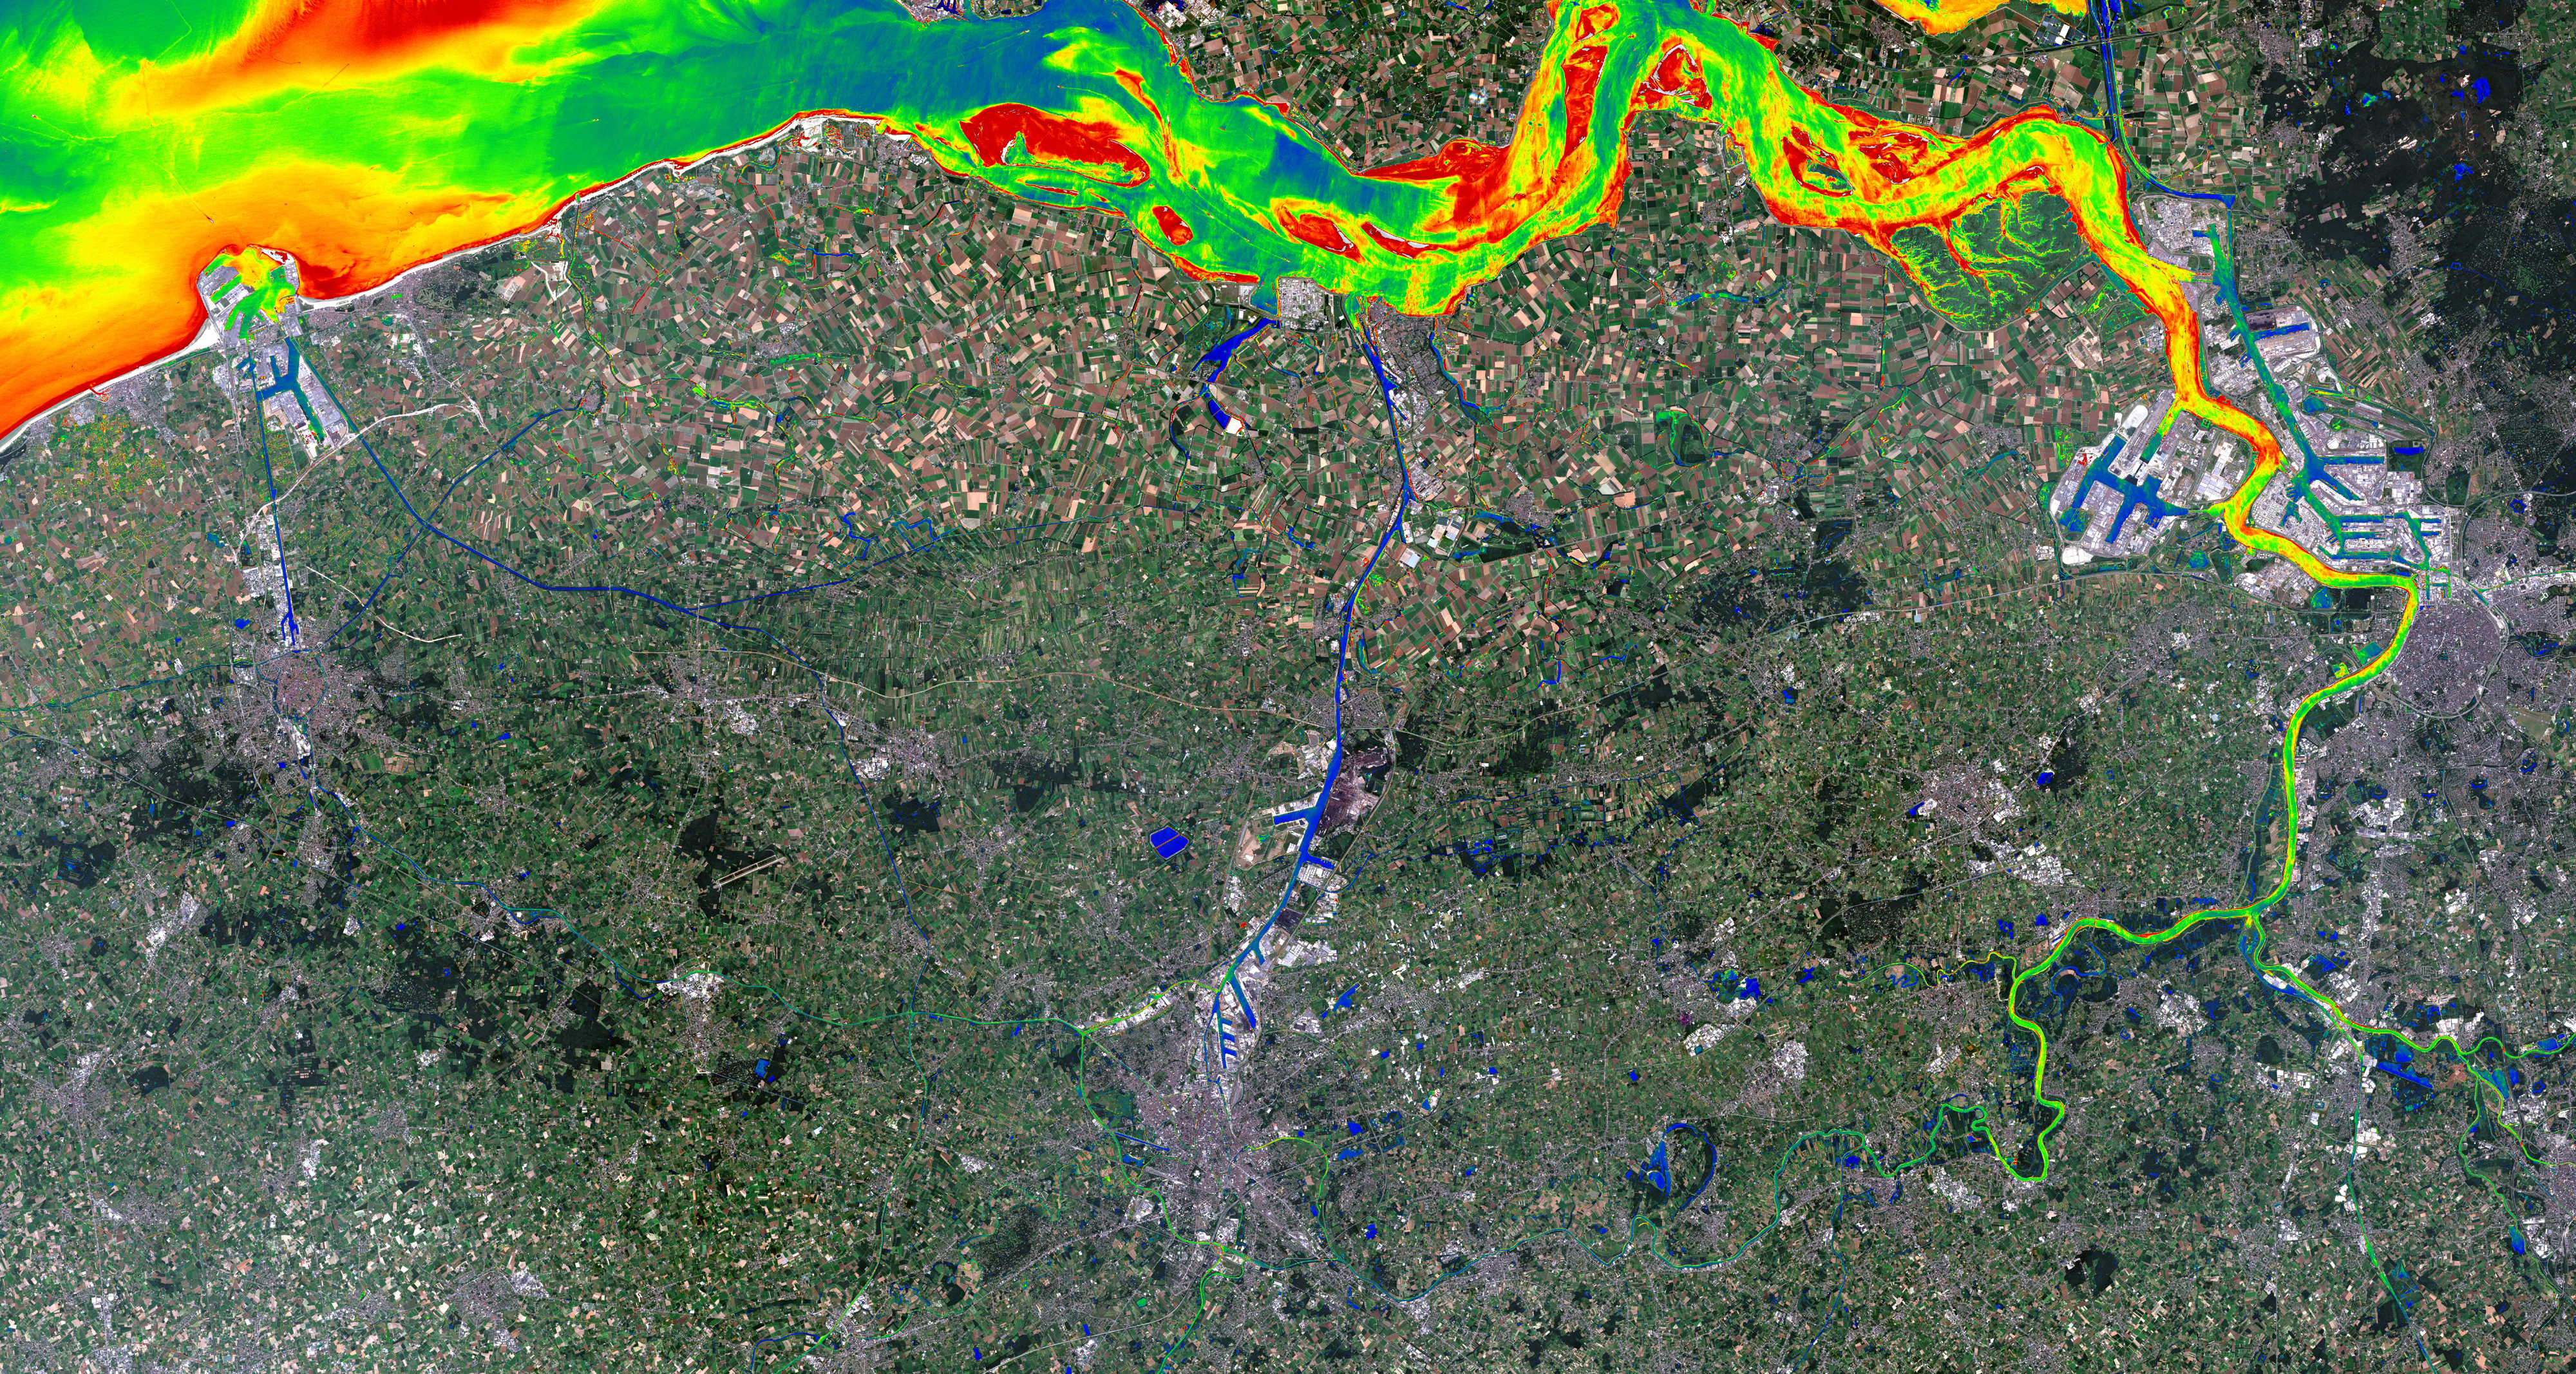
What it looks like
This colourful map of the rivers in Flanders shows the suspended sediment concentrations. Red colours show the areas with the highest suspended sediment concentrations and the blue colours, mainly in the docks of the harbour of Antwerp, show the lowest concentrations.