Measuring the impact of drought in a wet and cold season!
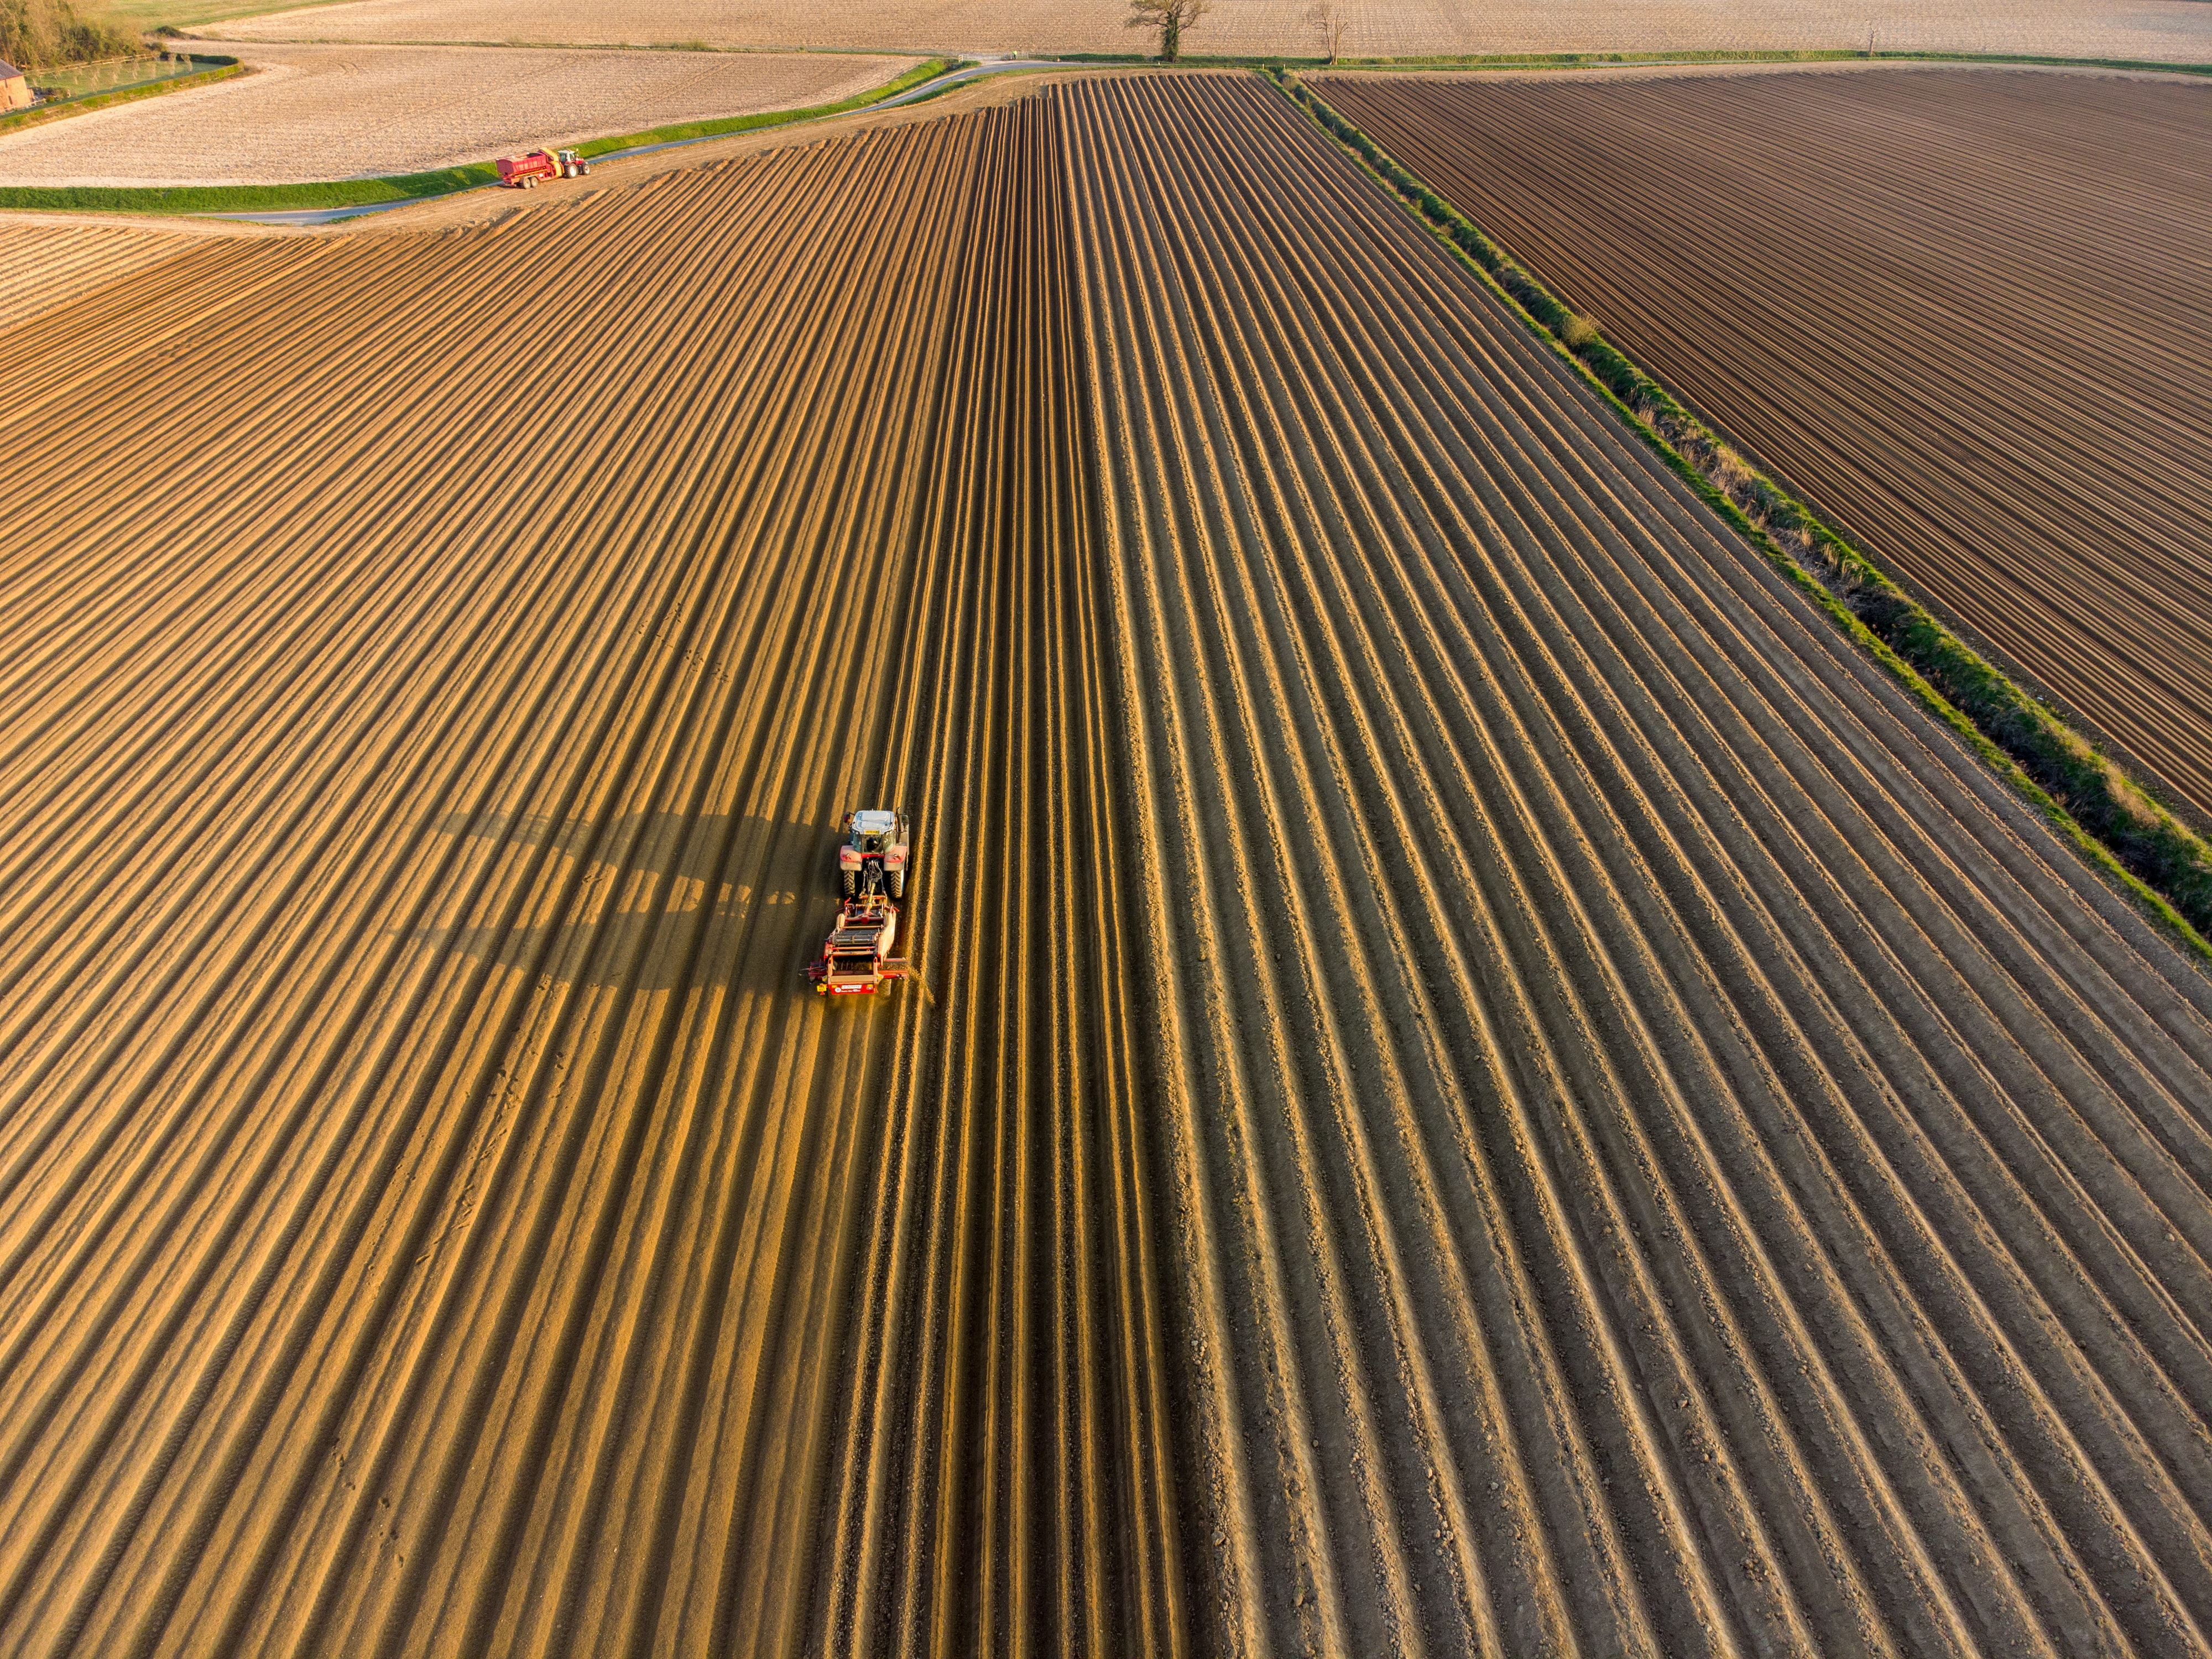
The past years we’ve experienced several hot and dry summers which of course also impact the agricultural sector. This triggered the ‘CurieuzeNeuzen in de Tuin’ (CNIDT) team to install 500 of the temperature and soil moisture sensors (also called ‘gazondolken’) in several potato fields, next to the citizen gardens and public green spaces, to monitor the impact of heat waves and long periods of droughts on our agriculture. Yet, the first summer with the sensors in place turned out to be very different from the ones before. The potatoes did not suffer from heat nor water stress in 2021. In some places there was rather too much than too little water. The summer of 2021 will be remembered as the wettest summer ever in Belgium, although there were large regional differences. 2021 was an example on how climate change leads to more extreme weather patterns. Nevertheless, the sensors provided interesting information.
In June 2021, at the start of the growing season, the sensors in were installed on 295 potato fields spread over Flanders. In a previous blog Bart Deronde, project coordinator of CNIDT agricultural measurements, already dug into the meteorological observations, the sensors measurements and the impact of the extreme weather on the cultivation of potatoes. Now we can share some insights of the first analysis performed on the sensor data.
A wet and cold season with a hot and dry start
The measurement campaign went successfully. We were able to include data of 461 sensors in the overall analysis of 2021. The sensors recorded soil temperature and moisture throughout the growing season. The measurement were stored in WatchITgrow where they were combined with classic weather station data, soil texture, and remote sensing data.
Let’s start with the temperature and soil moisture data results. To illustrate the 2021 weather, we picked out two fields: one in the West and one in the East of Flanders. In the West we selected a field on a clay soil (Heuvelland). and in the East one on a sandy soil (Kasterlee).
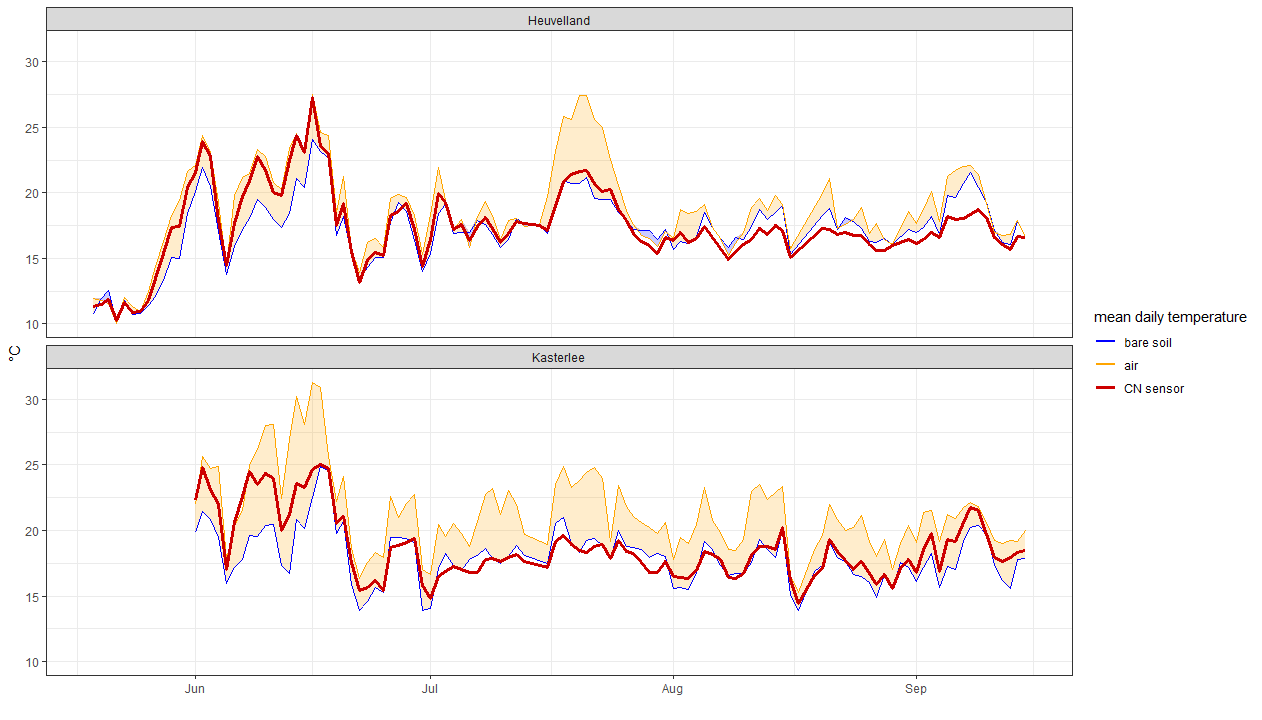 Figure 1: Mean daily temperatures at a field on a clay soil (Heuvelland) and a sandy soil (Kasterlee).
The highest temperatures of the summer in 2021 were observed in June. The rest of the summer was relatively cool. The sensor temperatures followed bare soil temperatures, until the canopy closed. From then onwards the temperature beneath the canopy was lower and often even below the air temperature. Sand and clay soils reacted differently to this temperature variation.
The first two weeks of June were not only hot but also dry. The rains started in the second half of June and were accompanied by a drop in temperature. The rest of the summer was characterized by heavy showers and the most striking one was the ‘water bomb’ on 14th of July. But when we look at the two fields above, we see very different results. This intense period of rains occurred in the East of Belgium, while the West underwent a dry spell at that moment.
The moist measurements followed the rains, although not in a one-to-one manner (see figure below). The hot dry period in June coincided with potato foliage development. The analysis therefore considered two distinct periods: June 10 - June 20 and July 1 – August 15.
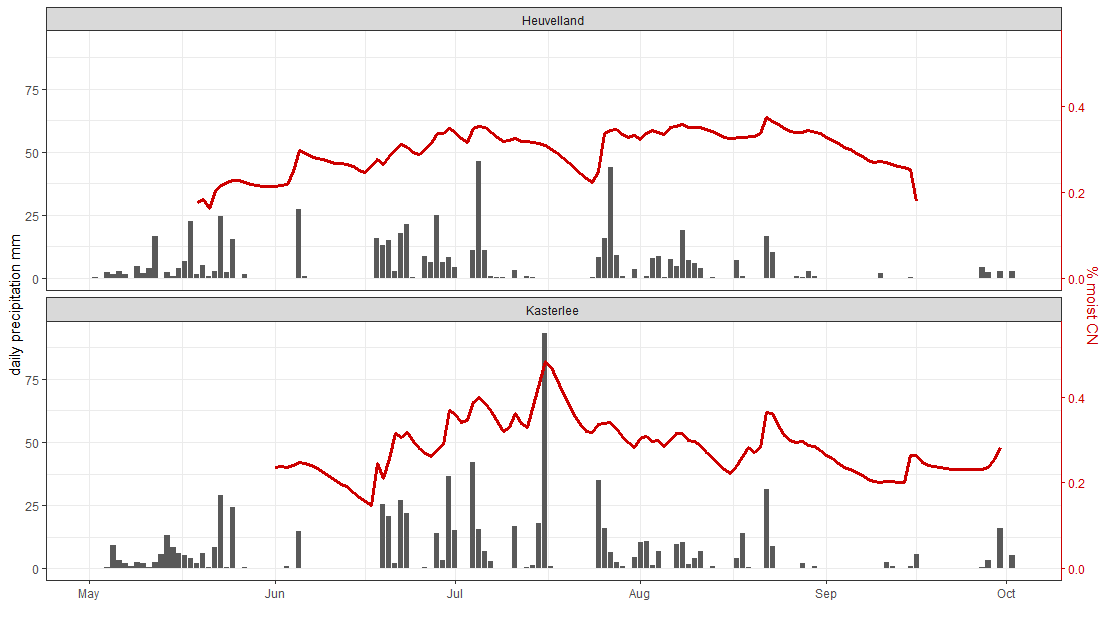 Figure 2: Daily rain (mm) and soil moisture measurement (%) at a field on a clay soil (Heuvelland) and a sandy soil (Kasterlee).
Cool canopies
The temperature underneath a crop canopy is interesting to monitor. It proved to be more temperate in comparison to bare soil temperature, which may indicate that plants are not under stress, allowing maximum plant growth. However, this is a complex interaction and is influenced by air temperature, soil texture (sandy soils heat up easier but have less plant available water compared to finer soil textures) and the density of the canopy.
Our hypothesis was that, at full canopy closure, an actively growing crop may transpire more and hence have a cooling effect. Conversely, it can also point at a sufficient soil moisture to allow this transpiration. When the canopy is less dense (as at the start of the season) the direct evaporation from the bare soil will be higher. These effects will probably be more pronounced on sandy soils.
To disentangle all these effects, we modelled the data and did this for both periods:
- the spring period of June 10-20, 2021 with a developing canopy under dry and hot circumstances
- the summer period July 1 – August 15, 2021 with more temperate conditions and sufficient water
The crop development was incorporated in the models through the daily FAPAR (fraction of Absorbed Photosynthetically Active Radiation) of the potato field obtained through satellite imagery. Soil texture, ambient temperature and potato race were also included in the modelling.
Canopy development under dry and hot circumstances
The models allow us to make predictions for specific situations. When asking prediction from the models, we vary the factors that we are interested in while keeping other factors fixed. Plotting these predictions, provides a clearer picture of the impact of the factors we were studying at that moment. The graph below is a prediction for the 15th of June under a Fontane potato crop plotted in function of FAPAR and this for 3 soil types (clay, sandy loam, sandy). At that time of the season, canopies were not closed on all fields. The actual FAPAR ranged between 0.1 and 0.9.

Figure 3: Modelled relationship between FAPAR and soil cooling under Fontane potato foliage on 15 June, for three types of fields.
The cooling and FAPAR were clearly linked and influenced by soil type. The cooling effect was more pronounced on sandy soils where cooling up to 8°C (i.e. compared to bare soil) was modelled.
The biggest difference in temperature is found when FAPAR is high, but the difference does not get bigger once the FAPAR reaches 0.5-0.6, whereas there is a strong positive link between FAPAR and cooling at lower FAPAR. However, one should consider that few fields in the dataset had FAPAR values above 0.5 at that moment (i.e. mid-June), which leads to modelling uncertainty.
Analyses of the summer period
For the rainy summer period a similar modelling exercise was done. Cooling in function of FAPAR was modelled for the Fontane potato fields on July 15th (see figure 4 below). The model indicated that the cooling was less pronounced (between 4 and 7 °C) compared to the dry period in June. This smaller cooling was related to the lower air temperature in summer compared to spring.
Figure 4: Modelled relationship between FAPAR and soil cooling under Fontane potato foliage on 15 July, for three types of fields.
Lessons learned in view of the 2022 measurements
Compared to the modelling exercise done in spring (see figure 3 above), the FAPAR was higher around the 15th of July and ranged between 0.7 and 1. Interestingly, due to abundance of data in this range, we can still see a positive relation between FAPAR and cooling, and there was even a reinforcing of the relationship at very high FAPAR. This could be an indication that very fast-growing crop transpires a lot of water and thus cools the atmosphere below the canopy. Noteworthy is that the cooling did not longer differ between the soil types (i.e. opposed to what was observed during spring).
These results indicate that monitoring temperature under a potato canopy reveals insight in the microclimate beneath the canopy cover which is linked to the physiological behaviour of the plants. In seasons with less water available, a lack of cooling could point to stress build up and maybe we will be able to study these dry and warm conditions as well later this year.
After a successful measurement campaign in 2021, CurieuzeNeuzen is happy to extend the research by one year. With the help of 3000 sensors, the heat and drought in 2022 will be monitored again. 200 of these sensors will be used again to monitor the microclimate on potato fields during the summer of 2022. In this way we expand our knowledge about the microclimate in which the plants thrive. The 200 sensors will again be connected with WatchITgrow to further monitor and analyze the results over both seasons.


/Blog%20Post%20Strip%20Cropping%20-%20Featured%20Image%201200x650%20150%20ppi.png)
/Blog_WorldCereal_1200x650.png)
/lewis-latham-0huRqQjz81A-unsplash.jpg)