
Forest as a natural carbon store
To meet the EU's ambitious goals to reduce emissions by 2030 and become climate neutral by 2050, significant societal and economic changes are necessary. Forests play a crucial role in this effort as they absorb carbon naturally and are able to replace emissions-intensive materials. Unfortunately, our forests are also threatened by human activities and climate change. The EU therefore also committed to protect all remaining primary and old-growth forests in Europe (Biodiversity Strategy, new Forest Strategy for 2030), while using and managing natural resources sustainably and contributing to climate neutrality and adaptation (updated Bioeconomy Strategy, Financial Taxonomy).
ForestPaths, a Horizon Europe project, is dedicated to design, quantify and assess policy pathways to optimize the contribution of forests and meet these multifaceted targets to become a climate-neutral and resilient society and economy. This includes adapting forests to climate change, preserving biodiversity, and ensuring the continued provision of forest ecosystem services. To facilitate the development of these pathways, comprehensive information about forest structure across Europe is essential.
Traditionally, forests are monitored using in-situ measurements such as National Forest Inventories (NFI). While these data are invaluable, they have some limitations, including restricted spatial and temporal coverage. By using earth observation data and machine learning models we can address these limitations and create high-resolution (10 m) maps of forest structure. These maps will support effective monitoring and modelling of European forests, crucial to define the right policy pathways.
Training forest structure models with EO data
We started with training prototype machine learning models of forest structure over Flanders, Belgium, using Sentinel-1, Sentinel-2 satellite data and localizing features in combination with spaceborne LiDAR data. The spaceborne LiDAR data are highly valuable to derive forest structure information and to train forest structure models.
Spaceborne LiDAR provides geolocated information on the 3D structure of the Earth surface, from which a suite of forest structure variables can be derived. Here, we used data collected by the Global Ecosystem Dynamics Investigation (GEDI) instrument. GEDI is a full-waveform LiDAR instrument mounted on the International Space Station (ISS), that provides a suite of forest structure and biomass metrics. We used four variables to train the forest structure models in ForestPaths:
- A relative height metric, used as a measure of canopy height
- Canopy cover, i.e., the percent of the ground covered by the vertical projection of canopy material (i.e. leaves, branches and stems only). Canopy cover can be derived at several heights. Here, we focus on canopy cover at 10 m height
- Foliage Height Diversity (FHD), a canopy structural index, describing the vertical heterogeneity of foliage profile. It is computed as Shannon's diversity index of the LAI profile. A high FHD value generally corresponds to more complex forest structure (e.g. caused by multiple canopy layers)
- Above-ground Biomass Density (AGBD), expressed in Mg/ha
Evaluation of the structure models
The models reached a coefficient of determination (R²) over the test set between 0.72 and 0.96 (using all observations) and between 0.21 and 0.33 (using only observations inside forests). The canopy height shows the highest coefficient of determination over the test set, followed by the AGBD, cover, and FHD.
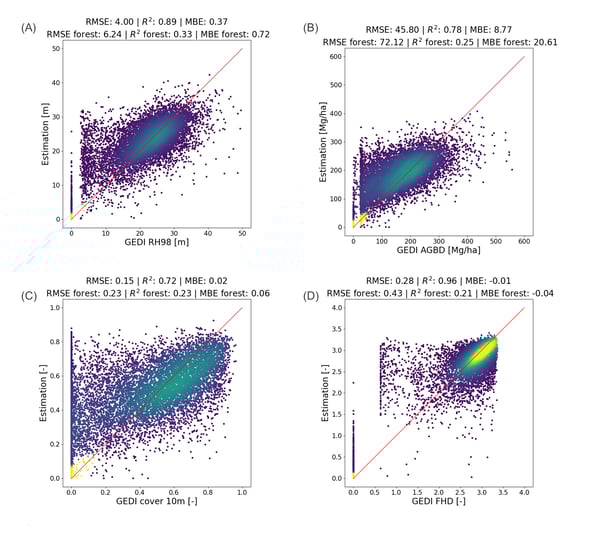
Scatter plots of the model estimations against the GEDI observations over the test set. The red line shows the 1:1 line and the colors indicate the point density. Outside forests, locations were randomly sampled across land cover types and their response value was set to zero. Inside forests, GEDI observations were randomly sampled.
Besides evaluating the forest structure models with GEDI observations over a test set, we compared the canopy height model estimations with an independent dataset, i.e., based on Airborne Laser Scanning (ALS) data. As shown in the figure below, the canopy height estimations showed a good agreement with the ALS-based height metric.
It is important to account for discrepancies between the data sets that may arise from factors other than just incorrect estimations. We keep in mind 2 important factors. Firstly, there is a temporal difference between the two data sources. The ALS data were collected between 2013 and 2015, while the forest structure model relies on satellite data from the year 2020. Consequently, we can anticipate some discrepancies due to changes in tree growth or losses over this period.
Secondly, the ALS height metric encompasses not only tree heights but also includes the heights of buildings and other structures. The forest structure model has been specifically designed to estimate only tree height. This can also lead to discrepancies between the two datasets.
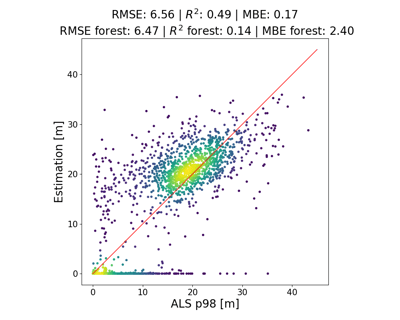
Scatter plots of the model estimation of canopy height against the ALS height metric.
Prototype forest structure maps
These new forest structure models enable us to generate prototype maps of wall-to-wall forest structure at 10 m resolution. These maps are extremely valuable to enrich the information that is currently provided by land cover maps. We started by creating four prototype maps of Flanders. Below you can see the prototype map showing canopy height over Flanders together with an uncertainty estimate.
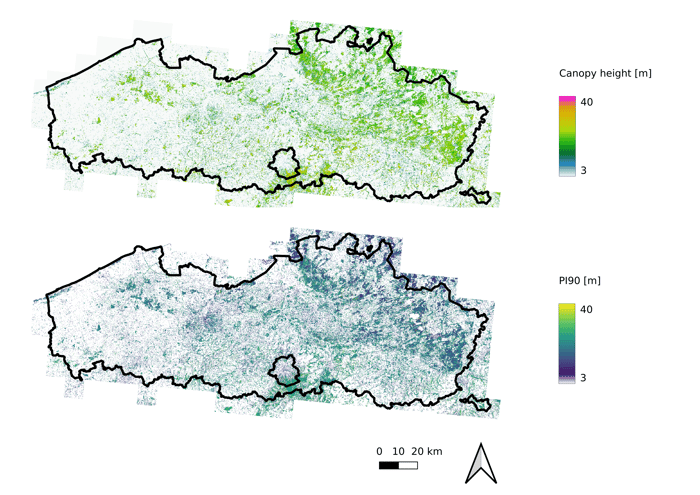
The prototype map of canopy height over Flanders, Belgium (top) and its uncertainty estimate (bottom), given by the 90th prediction interval.
These forest structure estimations reveal spatial explicit patterns of the forest structure metrics which are crucial to delineate areas covered with trees and identify variations in:
- canopy height
- above-ground biomass density
- canopy cover
- foliage height diversity across the forest
Below you can see an example of these maps with a zoom on a region in Antwerp (forest-urban-grassland mosaic). Next to the orthophoto and ESA WorldCover map 2021, you can see the canopy height estimation, above ground biomass density, canopy cover at 10m, and height diversity.
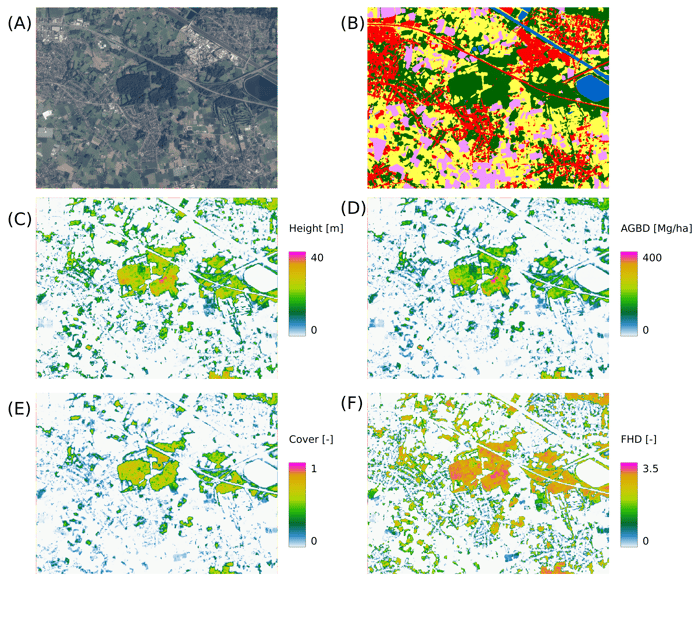
Example of forest structure estimations over a forest-urban-grassland mosaic in Flanders (near Antwerp)
Towards EU forest structure estimations and policy pathways
ForestPaths officially started in September 2022. Building these prototype maps was a first step. In the next months, we will use these forest structure estimations over Flanders to finetune and scale the models, and provide forest structure estimations at 10 m resolution at European scale. In addition, we are working on modelling and mapping forest composition, i.e., dominant tree species, across Europe. ForestPaths will use this information to develop policy pathways to optimize the contribution of forests. Stay tuned for more.

/lewis-latham-0huRqQjz81A-unsplash.jpg)
/boudewijn-huysmans-_iyh6g5KHQA-unsplash.jpg)