
Explore continental habitat mapping over Europe
The latest assessment on the state of the European environment, published by the European Environment Agency (EEA), shows that Europe’s biodiversity continues to decline at an alarming rate, with most protected species and habitats found not to have a good conservation status. It is clear that much more efforts are needed to reverse current trends and to ensure resilient and healthy nature.
To define more efforts or efforts that can have more effect we need to improve our biodiversity and ecosystem monitoring services in order to support our European policy makers. For this we are looking towards new Artificial Intelligence (AI) techniques. By using Neural Networks or Deep Learning methods and satellite-based high-resolution datasets such as the Copernicus High Resolution Vegetation Phenology Product (HR-VPP) we can improve our knowledge on where habitats occur across Europe, a crucial element for improving biodiversity conservation and taking specific actions.
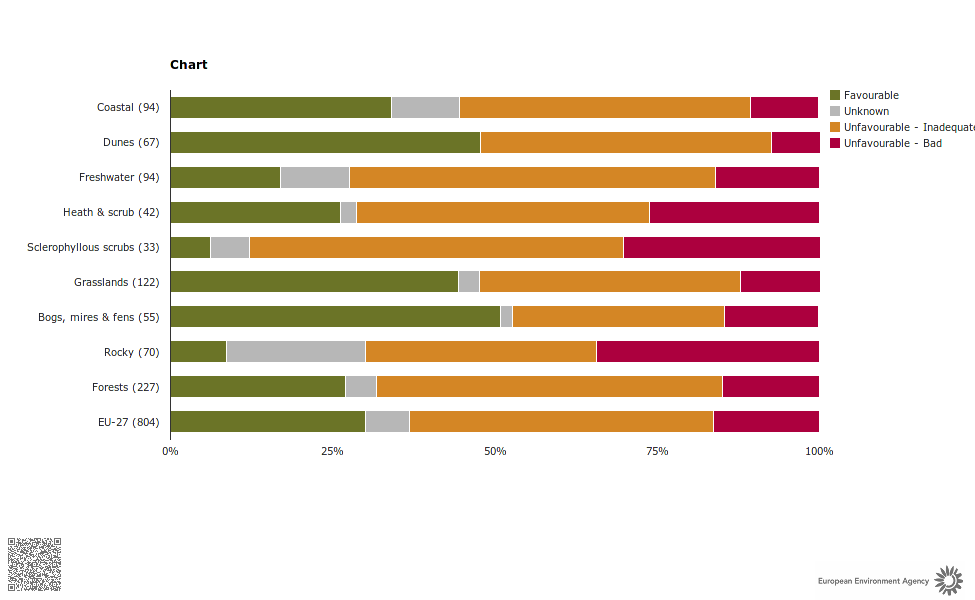
Conservation status of European habitats, source European Environment Agency
AI to model terrestrial habitat distribution
The European Environment Agency (EEA) requested a feasibility study to use novel AI/ML techniques to model the distribution of high-resolution (10m) terrestrial habitats. This study, conducted in cooperation with Wageningen Environmental Research, explored semi-automated solutions to generate continental habitat maps through the use of the high-resolution satellite based datasets together with other ancillary data and in-situ observations. The European Vegetation Archive (EVA), a continent-wide integrated electronic database of vegetation-plot records, acts as training data to open the option to characterize habitats at European scale in a harmonized way. Current habitat suitability maps are at coarse resolution and not recent, Article 17 dataset (Annex-I) represents the period 2013-2018 at 10 km spatial resolution, while representing the period until 2017 at 1 km spatial resolution. This novel approach generates recent (2020) habitat maps at 10m spatial resolution.
The study is conducted in close cooperation with EuropaBON, a collaborative action to design a cost-efficient framework for the future monitoring of biodiversity across Europe. One showcase within this project illustrates an Essential Biodiversity Variable (EBV) and Essential Ecosystem Service Variable (EESV) workflow from observations to support decision-support related to the Habitats Directive. Such habitat maps will also contribute to support Natural Capital Accounting. More particular the ecosystem accounting extent typology at its highest detail (Level-3) in Europe is based on the EUNIS habitat typology.
Creating European wall-2-wall habitat maps
Following an intensive literature study, a first fully automated workflow was developed to generate habitat maps for Annex-I and EUNIS typology at Level-3. The first part of the workflow generates in total 178 predictors at regional scale to provide information at 10 m spatial resolution including elevation (DEM), vegetation phenology (Copernicus HRVPP), spatial context (via Convolution Neural Network),temporal statistics (yearly cycle) data derived from remotely sensed data (Copernicus Sentinels), and at coarser resolution information on climate and soil.
The second part of the workflow selects the best predictors to solve the classification tasks for the area of interest via a separability analysis and hence introduces regionalization of the model in an automated way. The best predictors (~60-70) together with the training data (EVA) are used to train the AI/ML model, a gradient boosting framework on decision trees (CatBoost). The CatBoost model was found best to deal with the different types of predictor streams provided and with limited to no parameter tuning to run at regional scale as different features (predictors) were found more important in one region than in another region.
Compared to suitability maps which can have multiple winners per pixel, habitat classification maps select one winning discrete habitat per pixel. Nevertheless, the CatBoost model provides classification probabilities per class allowing enhanced post-processing (e.g. Copernicus High Resolution Layers, Maxent habitat suitability maps). The prototype workflow allows us to create a wall-2-wall habitat map within less than one processing day per region.
Preliminary results
This workflow was used to generate classified habitat wall-2-wall maps at 10 m spatial resolution over three regions: the Netherlands including 43 Annex-I habitats, Austria including 45 EUNIS level-3 habitats, and South-Portugal including 16 EUNIS level-3 habitat types. After a validation against national reference data, all three classified habitat maps reached an accuracy that follows the agreement of the independent training dataset (EVA) to the national reference maps.
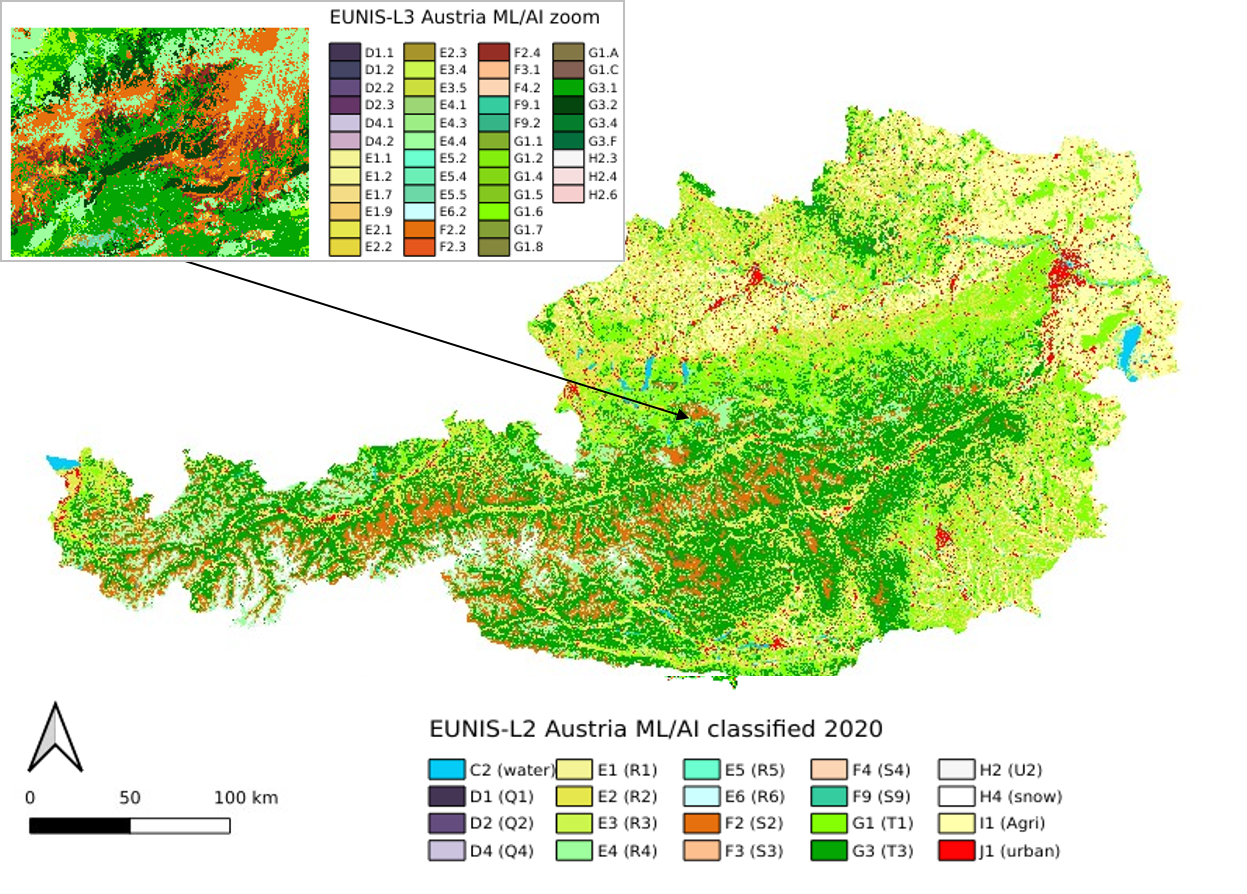
AI/ML classified EUNIS habitat map at level-2 at 10 meter spatial resolution for Austria (Note: insert shows a zoom-in at EUNIS Level-3)
AI/ML classified habitat maps are highly complementary to habitat suitability layers (e.g. calculation with Maxent). Where suitability layers show the potential existence of habitats, the classification layers show the actual habitat at a certain moment in time. The combination of both layers can be directly used for policies as restoration law, pollination initiative, preserving Europe’s natural capital.
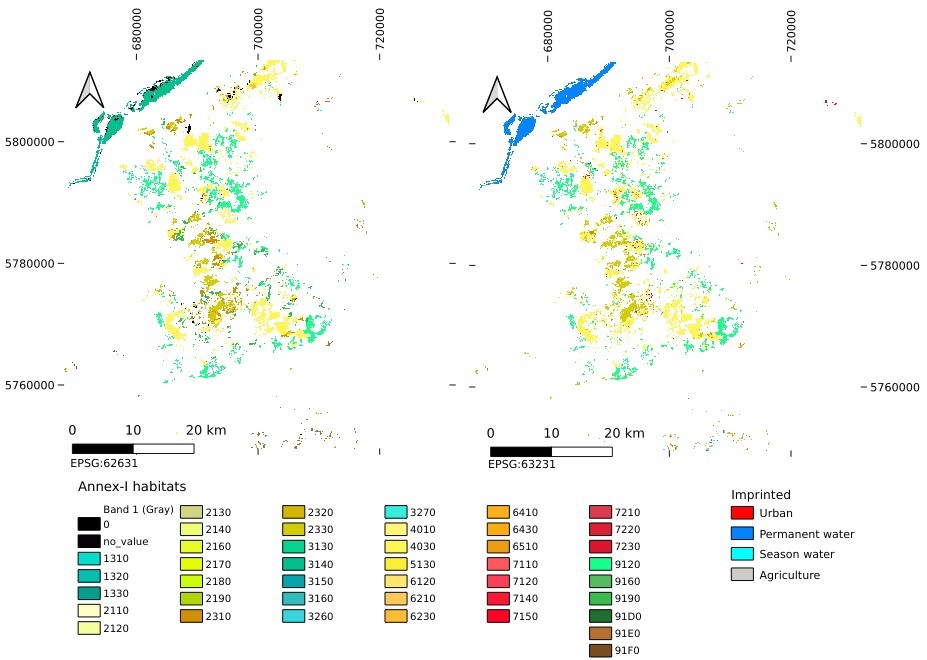
A visual comparison of Annex-I national map (left) and the AI/ML classified map (right) for Veluwe Natura2000 site. Note the classified map provides a wall-2-wall map but was masked for Natura2000 pixels to enable a visual comparison in this image
What's next?
The results of this feasibility study prove the potential of applying fully automated AI/ML techniques for habitat mapping to produce European wall-2-wall habitat mapping in a fast and cost-efficient manner. But we can’t stop here. With better training data (geolocation accuracy, sample size per habitat and distribution) the potential of using AI and Machine Learning for automated high-resolution habitat mapping can be further explored through the inclusion of additional predictors (e.g. high resolution vegetation height, other topographic indicators, etc.) and potential use of future EO (hyperspectral) signals. Some further experiments will be conducted in the context of the H2020 EuropaBON project.
The EuropaBON project receives funding from the European Union’s Horizon 2020 research and innovation program under grant agreement No 101003553. More information can be found at https://europabon.org/. The study was co-funded by the European Environment Agency (EEA) and conducted in collaboration with Wageningen Environmental Research (WENR). The results shown above are preliminary and do not necessarily present the view of EEA.

/Blog_CORSA_1200x650.png)
/lewis-latham-0huRqQjz81A-unsplash.jpg)
.jpg)