A notebook application tailored for remote sensing users
The PROBA-V MEP (Mission Exploitation Platform) Notebooks web application lets you create and share documents that contain live code, equations, visualizations and explanatory text. It is based on the Open Source Jupyter notebooks application, and tailored to the needs of remote sensing users.
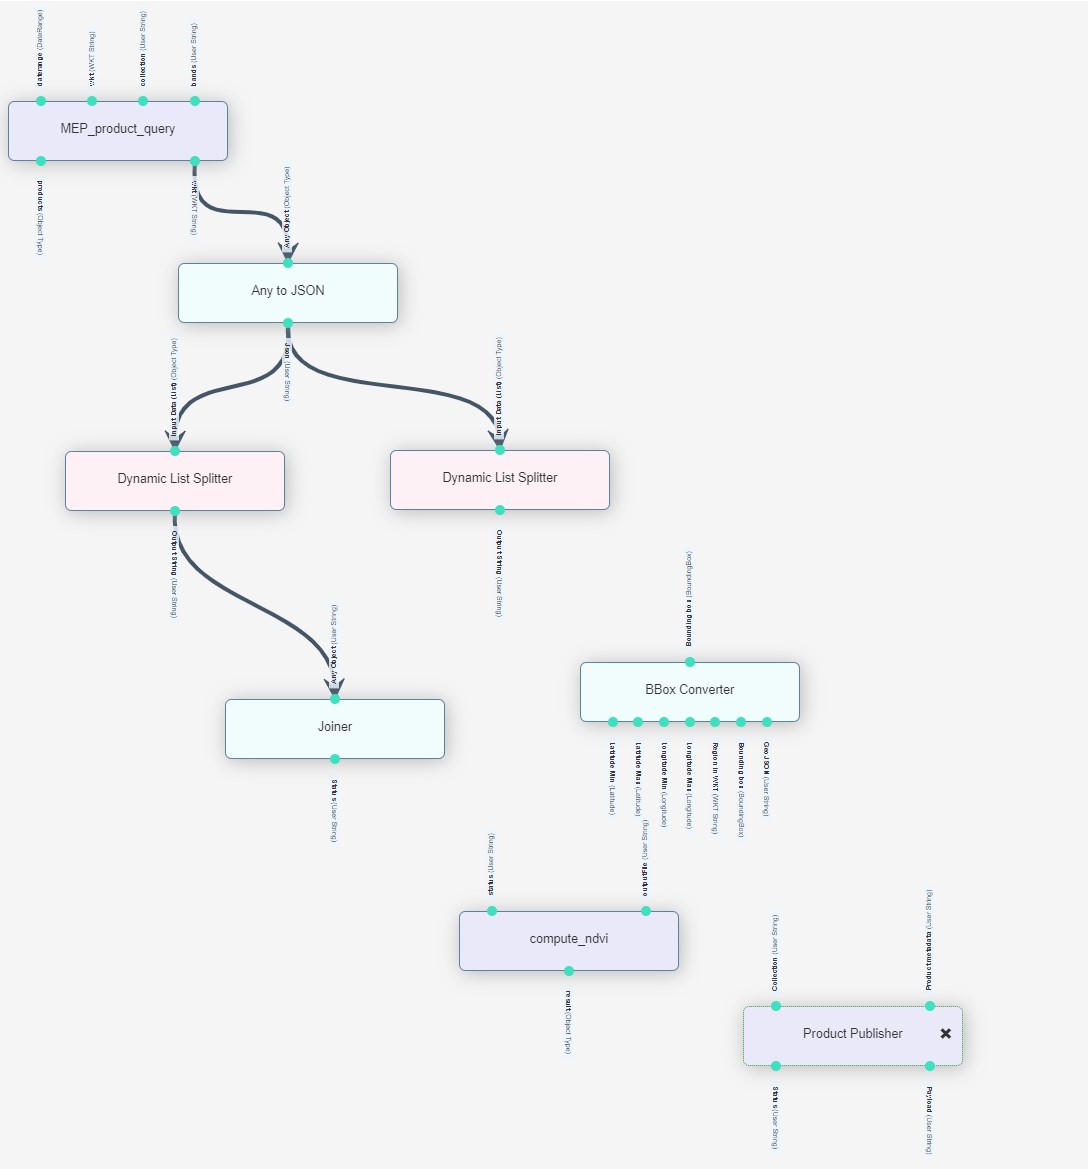
For programming, you can choose between the Python and R programming languages. We also include an ever growing list of software libraries such as GDAL, rasterio, pandas, numpy, matplotlib and seaborn so you can start immediately. It is even possible to install and upload your own packages and files. Check out some examples to get a better idea of what you can achieve.

Connecting valuable EO data with powerful processing power
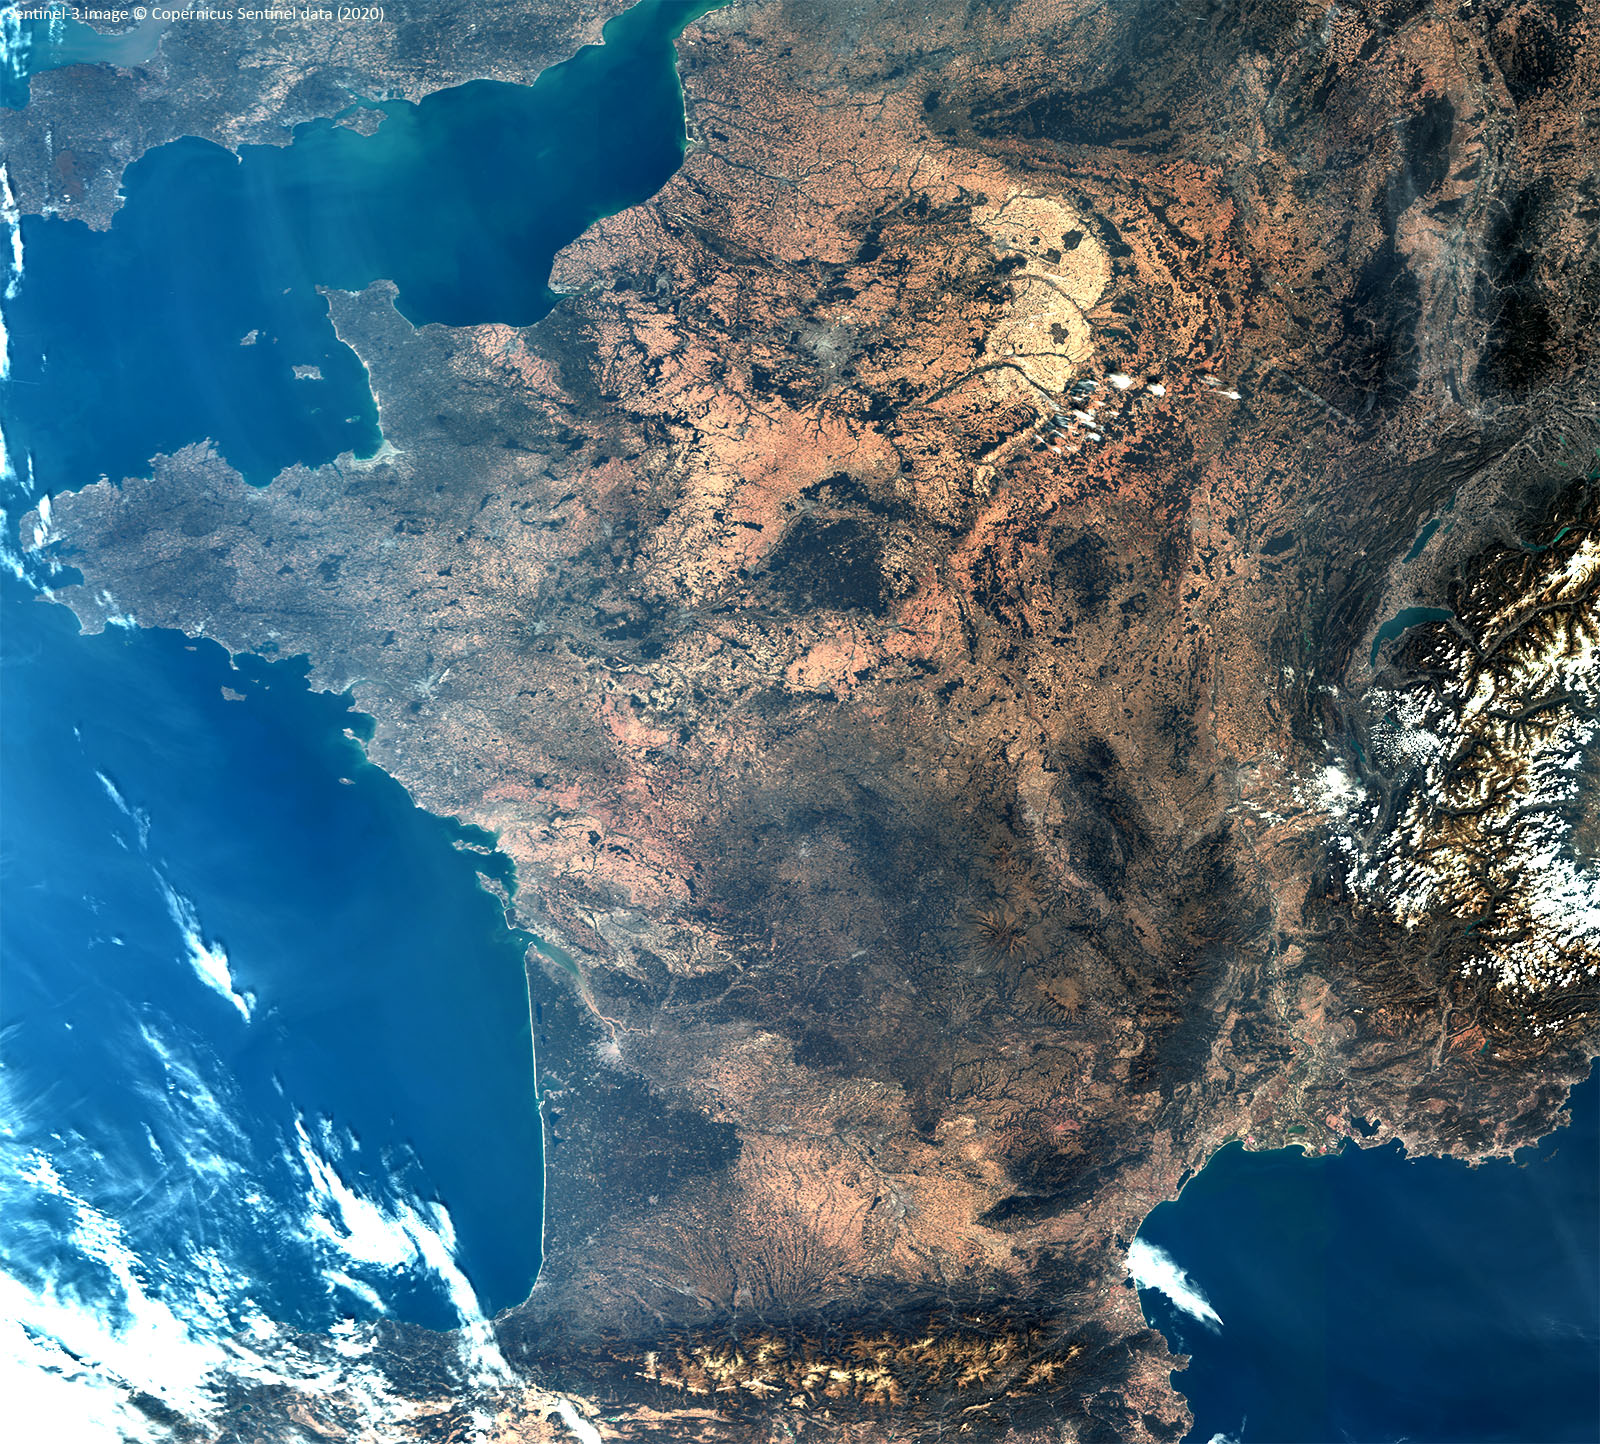
But what makes this new application so special? It is the direct and easy access to the complete PROBA-V and SPOT-VGT archive, representing over 18 years of continuous EO data. In order to make sure this remains an ‘interactive’ experience, we have added processing power: more than 1500 processing cores, combined with more than 4TB of memory, in the form of a Spark based processing cluster.
Everyone who wants to do research or develop applications with the PROBA-V and SPOT-VGT data can use this application free of charge.
Let’s get you started
To get you started, we’ve created a few examples that are available in a public repository and inside your personal Notebook environment once you’ve logged on. All the examples are well documented, so don’t hesitate to dive in and run them yourself if you’re interested.
Our sample gallery gives an overview, with the most important concepts used in each sample.
The highlights include: a quick start sample, doing distributed in a few lines of code, another one uses the Spark machine learning library to train a classifier to detect snow in PROBA-V images, and finally, we analysed trends in the time series data used in our TSViewer app, which came up with some nice results!
Click here to register and get started with the new PROBA-V MEP Notebook application.
MEP Notebooks, ready for your experiments
With the PROBA-V MEP Notebooks we bring the processing power to the EO data, and it’s available for your experiments for free. We are sure that this will stimulate innovation, and will result in valuable new insights in areas such as climate change, food security, etc.