Knowing ecosystems' CO2 uptake
Since the launch of the first NOAA satellites in the early 80’s, scientist have been working on ways to use Earth observation data to estimate how much CO2 is being taken up by plants worldwide. Knowing the magnitude of these carbon fluxes over space and time provides relevant information for various domains:
- Climate scientists can use these data to reduce uncertainties in earth system models that simulate ongoing earth processes and predict future climate scenarios
- If we know how much atmospheric CO2 can be recovered and stored in our ecosystems, we can quantify their value to mitigate climate change
- Biomass production can be estimated, which is strongly linked with natural resources such as crop yield, pasture available for livestock and timber in forests
EStimating primary production on a global scale
Gross Primary Production or GPP is a term used to describe the rate at which plants produce organic compounds in an ecosystem, so basically photosynthesis but at large scales. But how can we measure GPP? Spread throughout the globe there are a few hundred measurement stations which provide information on carbon fluxes between the atmosphere and the surrounding vegetation. Where these data provides unprecedented insights at the local level, there is also a clear need for worldwide estimates. Satellite data provide us with information on a quasi-daily basis on how much of the sunlight is actually absorbed by plants. By combining satellite based vegetation indices with information on weather conditions we can estimate GPP at larger scales.
LAnd Surface Temperature (LST) and photosynthesis
In TerrA-P, an ESA project set up to define, implement and validate a model to derive information on the vegetation productivity, we tested the upscaling of the state-of-the-art P-model of Imperial College of London on Sentinel-3 data. The Sentinel-3 satellites provide simultaneous information on both vegetation condition (fAPAR) and land surface temperature (LST). By combining these two observations, we can overcome one of the main sources of uncertainty in existing GPP models: estimating photosynthesis during major droughts.
The figure below illustrates the rationale behind this approach based on a real case, an in-situ GPP site located in a forest in Belgium. A more thorough analysis on in-situ sites spread throughout the globe also confirms that LST can bring added value for primary production models.

Sentinel 3 observations for an in-situ GPP site located in a forest in Belgium. In 2018, there was barely no rain in July in this region, resulting in a major drought. The orange line on the lower graph shows the effect on photosynthesis based on actual in-situ carbon flux measurements: a clear reduction from July onwards. The red line in the upper graphs are the observed Sentinel 3 fAPAR observations. The signal shows a small dip in July, but this observation is eliminated by smoothing and gap filling pre-processing procedures. These are needed to remove outliers caused by undetected clouds and for a continuous monitoring. The middle graph shows the temperature. The olive color stars are air temperature measurements from the in-situ station. The blue line are the Sentinel 3 based Land Surface Temperature (LST) data. Here we can observe elevated values during the drought period. This effect is caused by plants closing their stomate to save water, reducing the transpiration cooling effect and increasing canopy temperature. When combing fAPAR and LST, we can reproduce the reduction in GPP during the drought (green line in lower graph).
Understanding global carbon flux dynamics
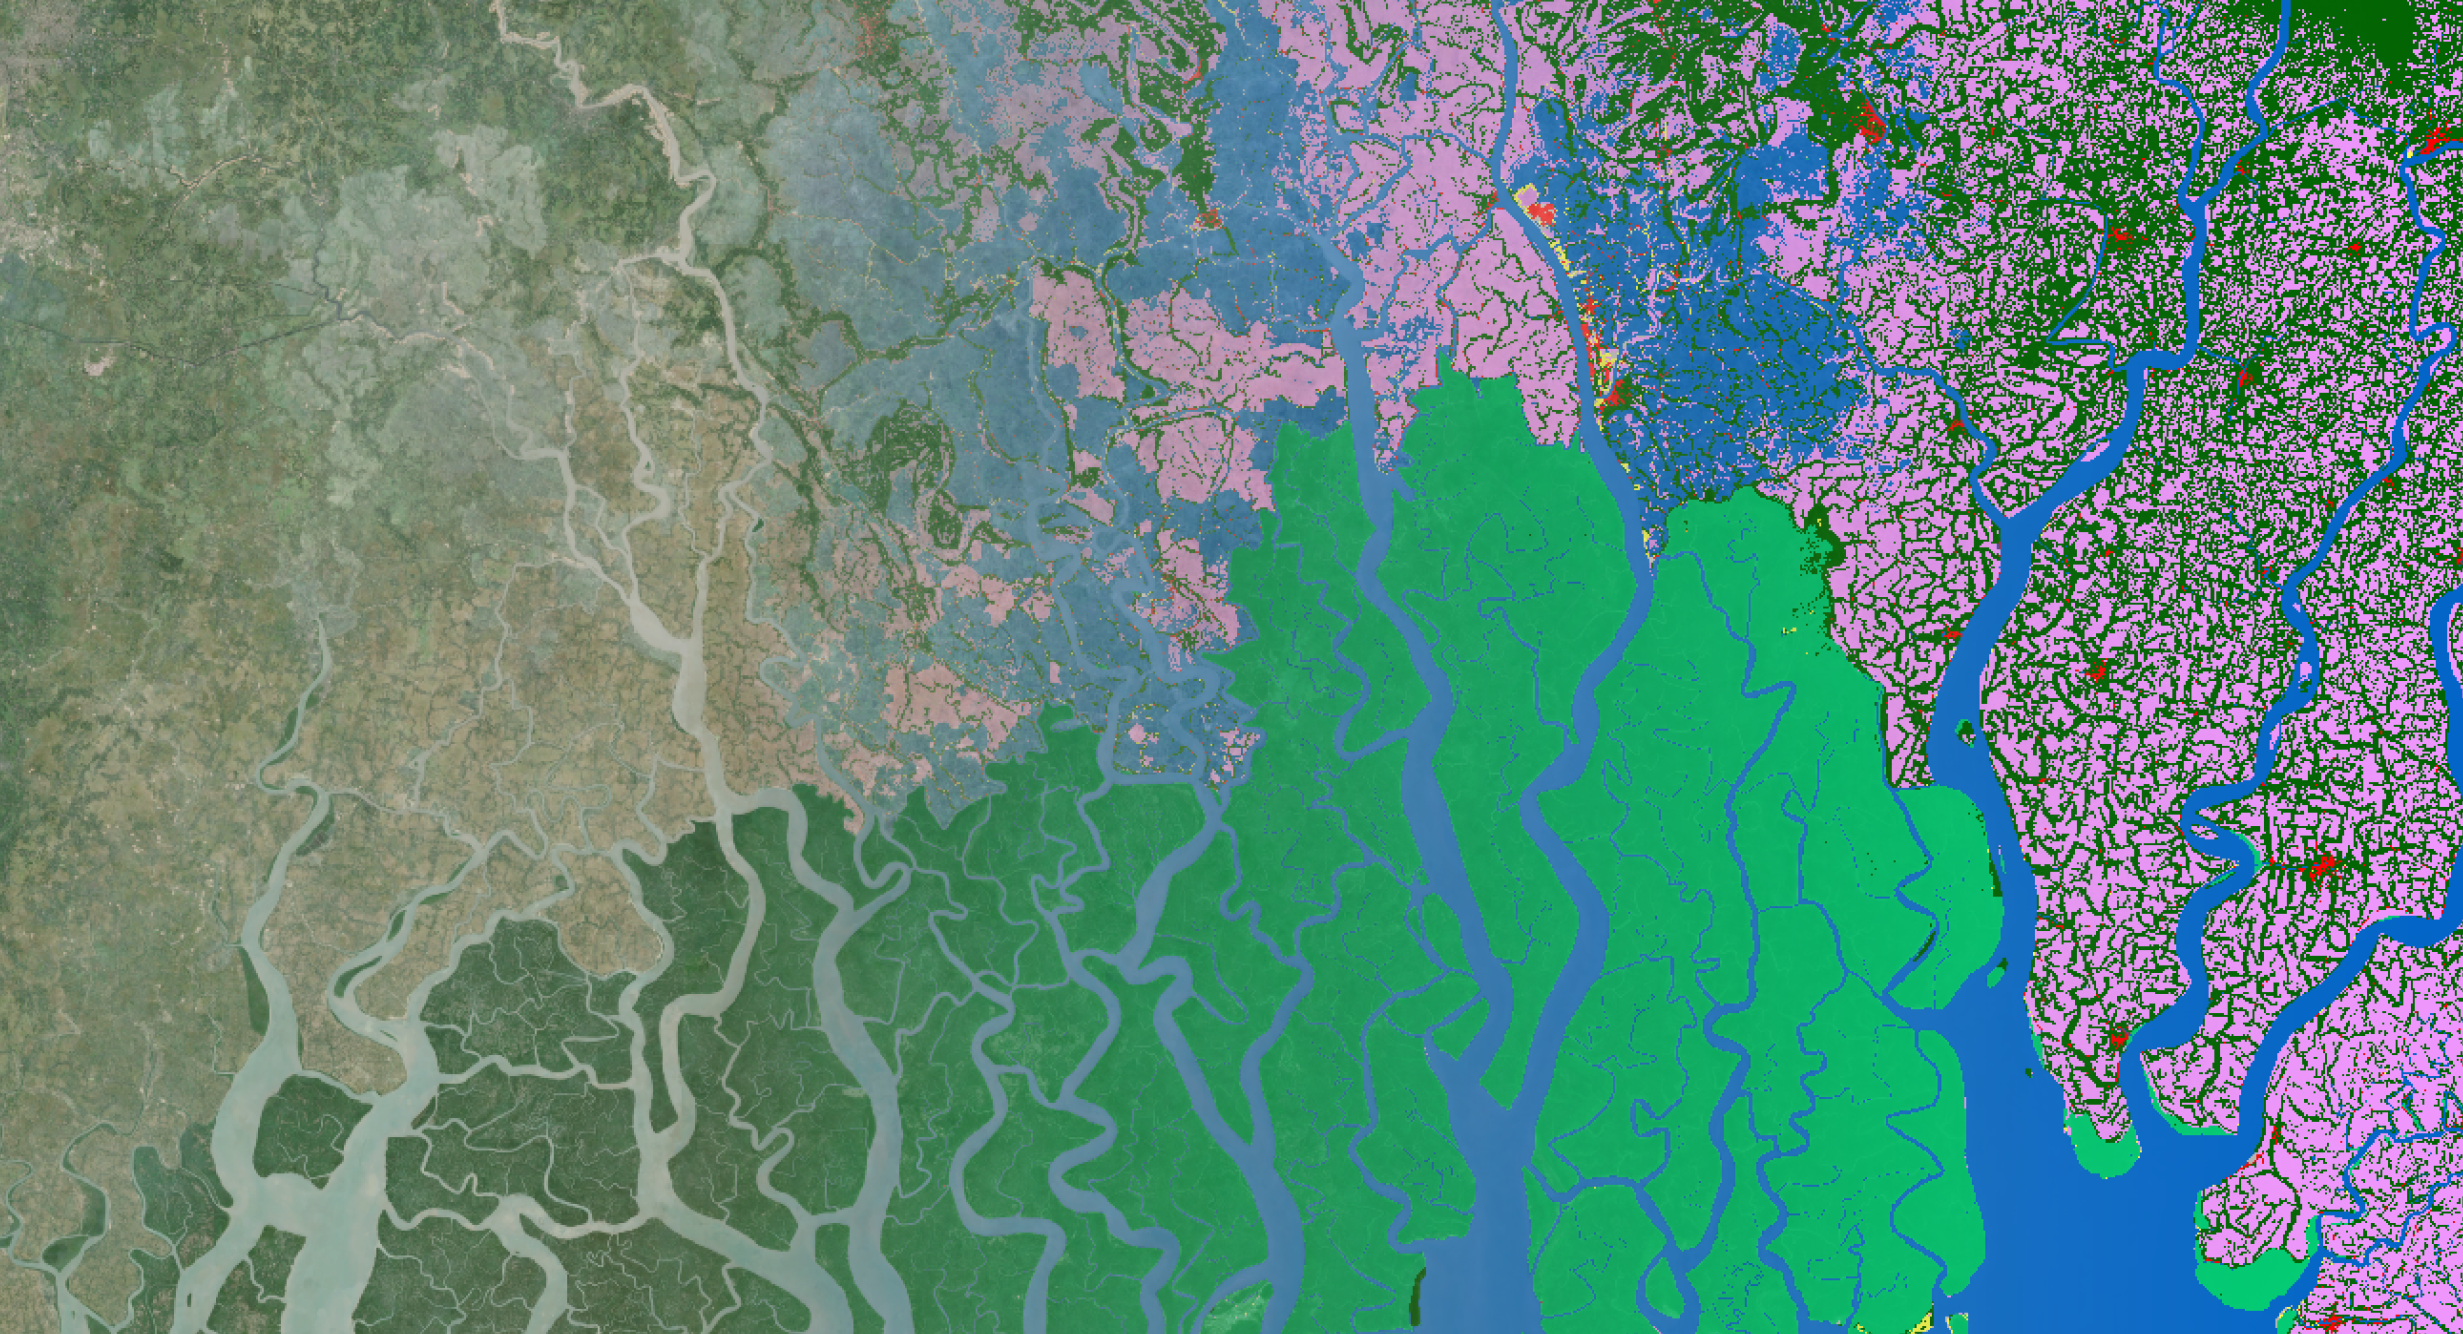
We also evaluated the upscaling of the P-model. We processed the year 2018 global Sentinel-3 fAPAR and LST data into 10-daily 500 m GPP estimates. With these kind of global primary production estimates, we can quantity the effect of extreme events e.g. severe droughts on the terrestrial carbon balance and the ecosystems’ productivity.
Global Sentinel-3 based Gross Primary Production (GPP) at a 10-daily time frame. At the start of the year, photosynthesis is quasi zero in most of the northern hemisphere, too cold and not enough sunlight. The sub-equatorial ecosystems are however active, absorbing each day more than 10 gram atmospheric carbon per square meter. About half of this carbon is quasi instantaneously burned to fuel the plants’ internal biomass factories to grow and maintain themselves. As spring kicks in Europe, primary production is increasing steadily. You may notice the increase is not linear and a bit jumpy from image to image. That is because the day to day weather conditions determine the actual rate of photosynthesis. In normal years, European ecosystems remain quite active until late summer. But in July 2018, a severe drought struck Western Europe. You can see the GPP going down rapidly from July onwards, showing a reduction in the amount of carbon uptake.
Terra-P: Beyond GPP and future plans
After 3 years of intensive research we have obtained:
- An improved P-model
- More in-situ data (mostly GPP)
- Enhanced fAPAR & LST pre-processing methodologies
In TerrA-P, we didn’t stop at Gross Primary Production (GPP) estimates. A first methodology was defined to convert GPP into Above-Ground Biomass Production (ABP), which is more closely linked to natural resources (yield, pasture, biomass, timber,…). We used one of the most comprehensive global datasets of in-situ measurements of above-ground biomass production (ABP). These in-situ data often dates back several decades, hampering the relation with our recent satellite data. But there is a strong need for a large scale in-situ data collection of ABP.
With these first successful results it would be unfortunate to stop. Therefore ESA decided to extend the project with 1.5 year to gain more in depth knowledge on the relation between LST & GPP and work on improved methodologies for Above-ground Biomass Production. The original team with Imperial College of London & University of Antwerp will be support by University of Leicester, renowned LST experts. Looking forward!

/lewis-latham-0huRqQjz81A-unsplash.jpg)
/boudewijn-huysmans-_iyh6g5KHQA-unsplash.jpg)