One platform with massive amounts of data
For us it’s obvious that satellite data have a lot to offer. And although more and more people are starting to use remote sensing technology, a lot of people are still just unaware of the value of the data.
Terrascope project manager Jurgen Everaerts says it fair and square: “We want to bring Terrascope to every household. Terrascope is not just valuable for the experienced R&D professional. It’s valuable for every citizen, because it shows the bigger picture of how the earth evolves” Under the hood, the detailed and high-quality data of the Sentinel satellites are processed to produce images and products that can be used by everyone.
Besides the data, Terrascope also offers services such as Web Services, Notebooks and Terraviewer.
So let’s get started. I’ll give you some information and examples on how to use Terrascope’s EO browser Terraviewer. The platform enables you to easily browse, view and download Sentinel-2 data over Belgian territory. The data is available from mid-2015 onwards, and every location is imaged every 5 days.
You can view 6 pre-defined layers, each one having specific characteristics and use:
- Natural color images (RGB), for an overview that is easily understood
- Color infrared images (CIR), where vegetation shows in red, are interesting for better discrimination and clear recognition of vegetated surfaces
- FAPAR shows the photosynthetic activity of green vegetation and is often used as a drought indicator.
- NDVI which describes the greenness of vegetation, and can be used to recognize different crop types and changes in vegetation conditions over time
- LAI which characterizes plant canopy structure and gives an idea of the amount of biomass
- FCOVER can be used to detect emergence problems (e.g. due to bad seeds) or damage due to extreme weather events such as floods,…
The value behind the data
The main value of Earth observation data of course lies behind the data and the services that can be developed by using or even combining various types of data. Let me give you some examples.
We all recall the persistent drought we’ve faced the past summer months. With Terraviewer you can clearly see the substantial impact on arable land after a persistent drought. Using the compare function you can easily compare natural color images of this and last summer, clearly illustrating how different the vegetation looks.
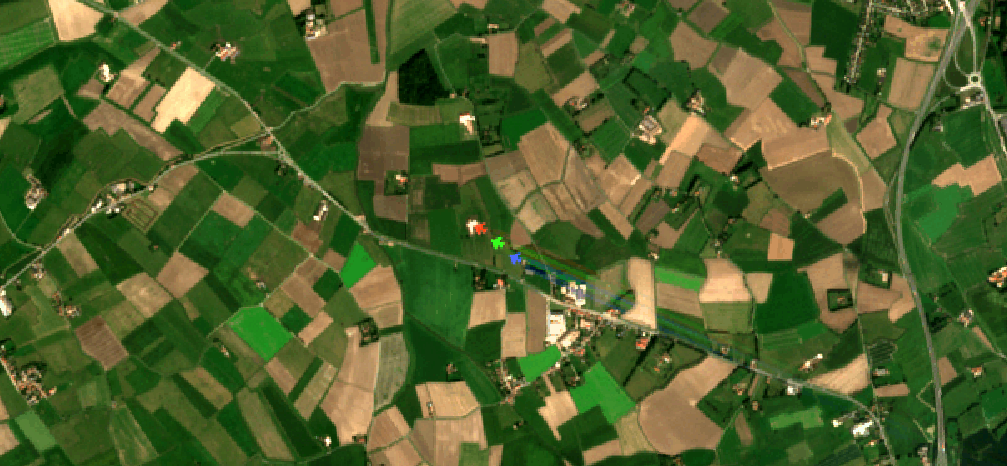
Sometimes you happen to notice strange artefacts, like 3 ‘colored planes’ over the Belgian airspace. In that case you can zoom in, save the image via the 'export' button and share it with your friends or the user community, to get an explanation.

You can even find out which football team in Belgium plays on artificial grass. In the normal visual spectrum, an artificial grass, just like any other lawn, will turn green. But compare it with one of the biopars FAPAR, LAI or FCOVER and you'll notice that the green surface is not really 'vegetation'.
Terrascope coming your way
For people new to using satellite data and remote sensing technology it’s useful to get a short introduction workshop. Or even if you’re an experienced user, but want to receive some interesting tips and tricks, a short demonstration can help you get the most out of your efforts.
That’s why we’re hitting the road and are organizing the Terrascope roadshows. The first one is scheduled in Brussels on 23 October and we have a second one in Ghent on 7 December dedicated to HOGent students.
In approximately 2 hours we'll show you how to get started. Register now for one of the Terrascope roadshows and you'll discover:
- Which Earth observation data is available and how you can access the data in just a few clicks
- Which data is valuable for which application (agriculture, urban, ... )
- Which information can be retrieved using EO data
- How to use Terraviewer and retrieve valuable information


/Blog_CORSA_1200x650.png)
/lewis-latham-0huRqQjz81A-unsplash.jpg)