Water for agriculture
As competition for water resources will keep increasing in the future, the amount of water used for food production is often under discussion. According to the FAO AQUASTAT, about 20% of the total cultivated land is irrigated, but contributes to about 40% of the total food produced worldwide. If you keep in mind that agriculture already accounts for 70% of all the water withdrawals on a global scale, it is evident that the water use efficiency in agriculture needs to be optimized.
Given the pressure on water resources, it is crucial to monitor agricultural water productivity and support farmers to use the available water in a more sustainable way. To this end, the Food and Agricultural Organisation of the United Nations (FAO) is releasing a new version of WaPOR, an operational and open access database to monitor agricultural water productivity in near real time, offering more/new data including improved land cover maps with irrigated areas.
The Copernicus Global Land 100 m land cover map is the base land cover information. We use this data to further specify the cropland class into irrigated and rainfed agriculture.
WaPOR, the online tool to monitor agricultural water productivity
New and improved irrigation cropland maps
WaPOR was officially released in 2017 to support Member Countries of FAO to monitor the agricultural water productivity via information on agricultural land use, crop cycles and biomass. One of the products in the new version WaPOR that has been significantly improved is the irrigated cropland map.
These irrigation maps show where agriculture is dependent on additional water sources for its production. With the improved irrigated cropland map you can even get a better view of what the water needs are in agriculture. This, in turn, can be combined with the productivity information in WaPOR to derive how efficient the water is being used, and to identify those areas where a further optimization is needed of the crop production system.
Evolution in irrigated areas around Office de Niger, Mali, between 2011 and 2016. Light pink denotes rainfed agriculture, dark pink irrigated areas.
Mapping irrigated croplands over Africa and the Near East
Irrigated cropland stand out in the fact that they consume much more water than is naturally available through precipitation. In the WaPOR data portal, all this information is available, and it allows to compare the water consumption with the precipitation, on a seasonal basis.
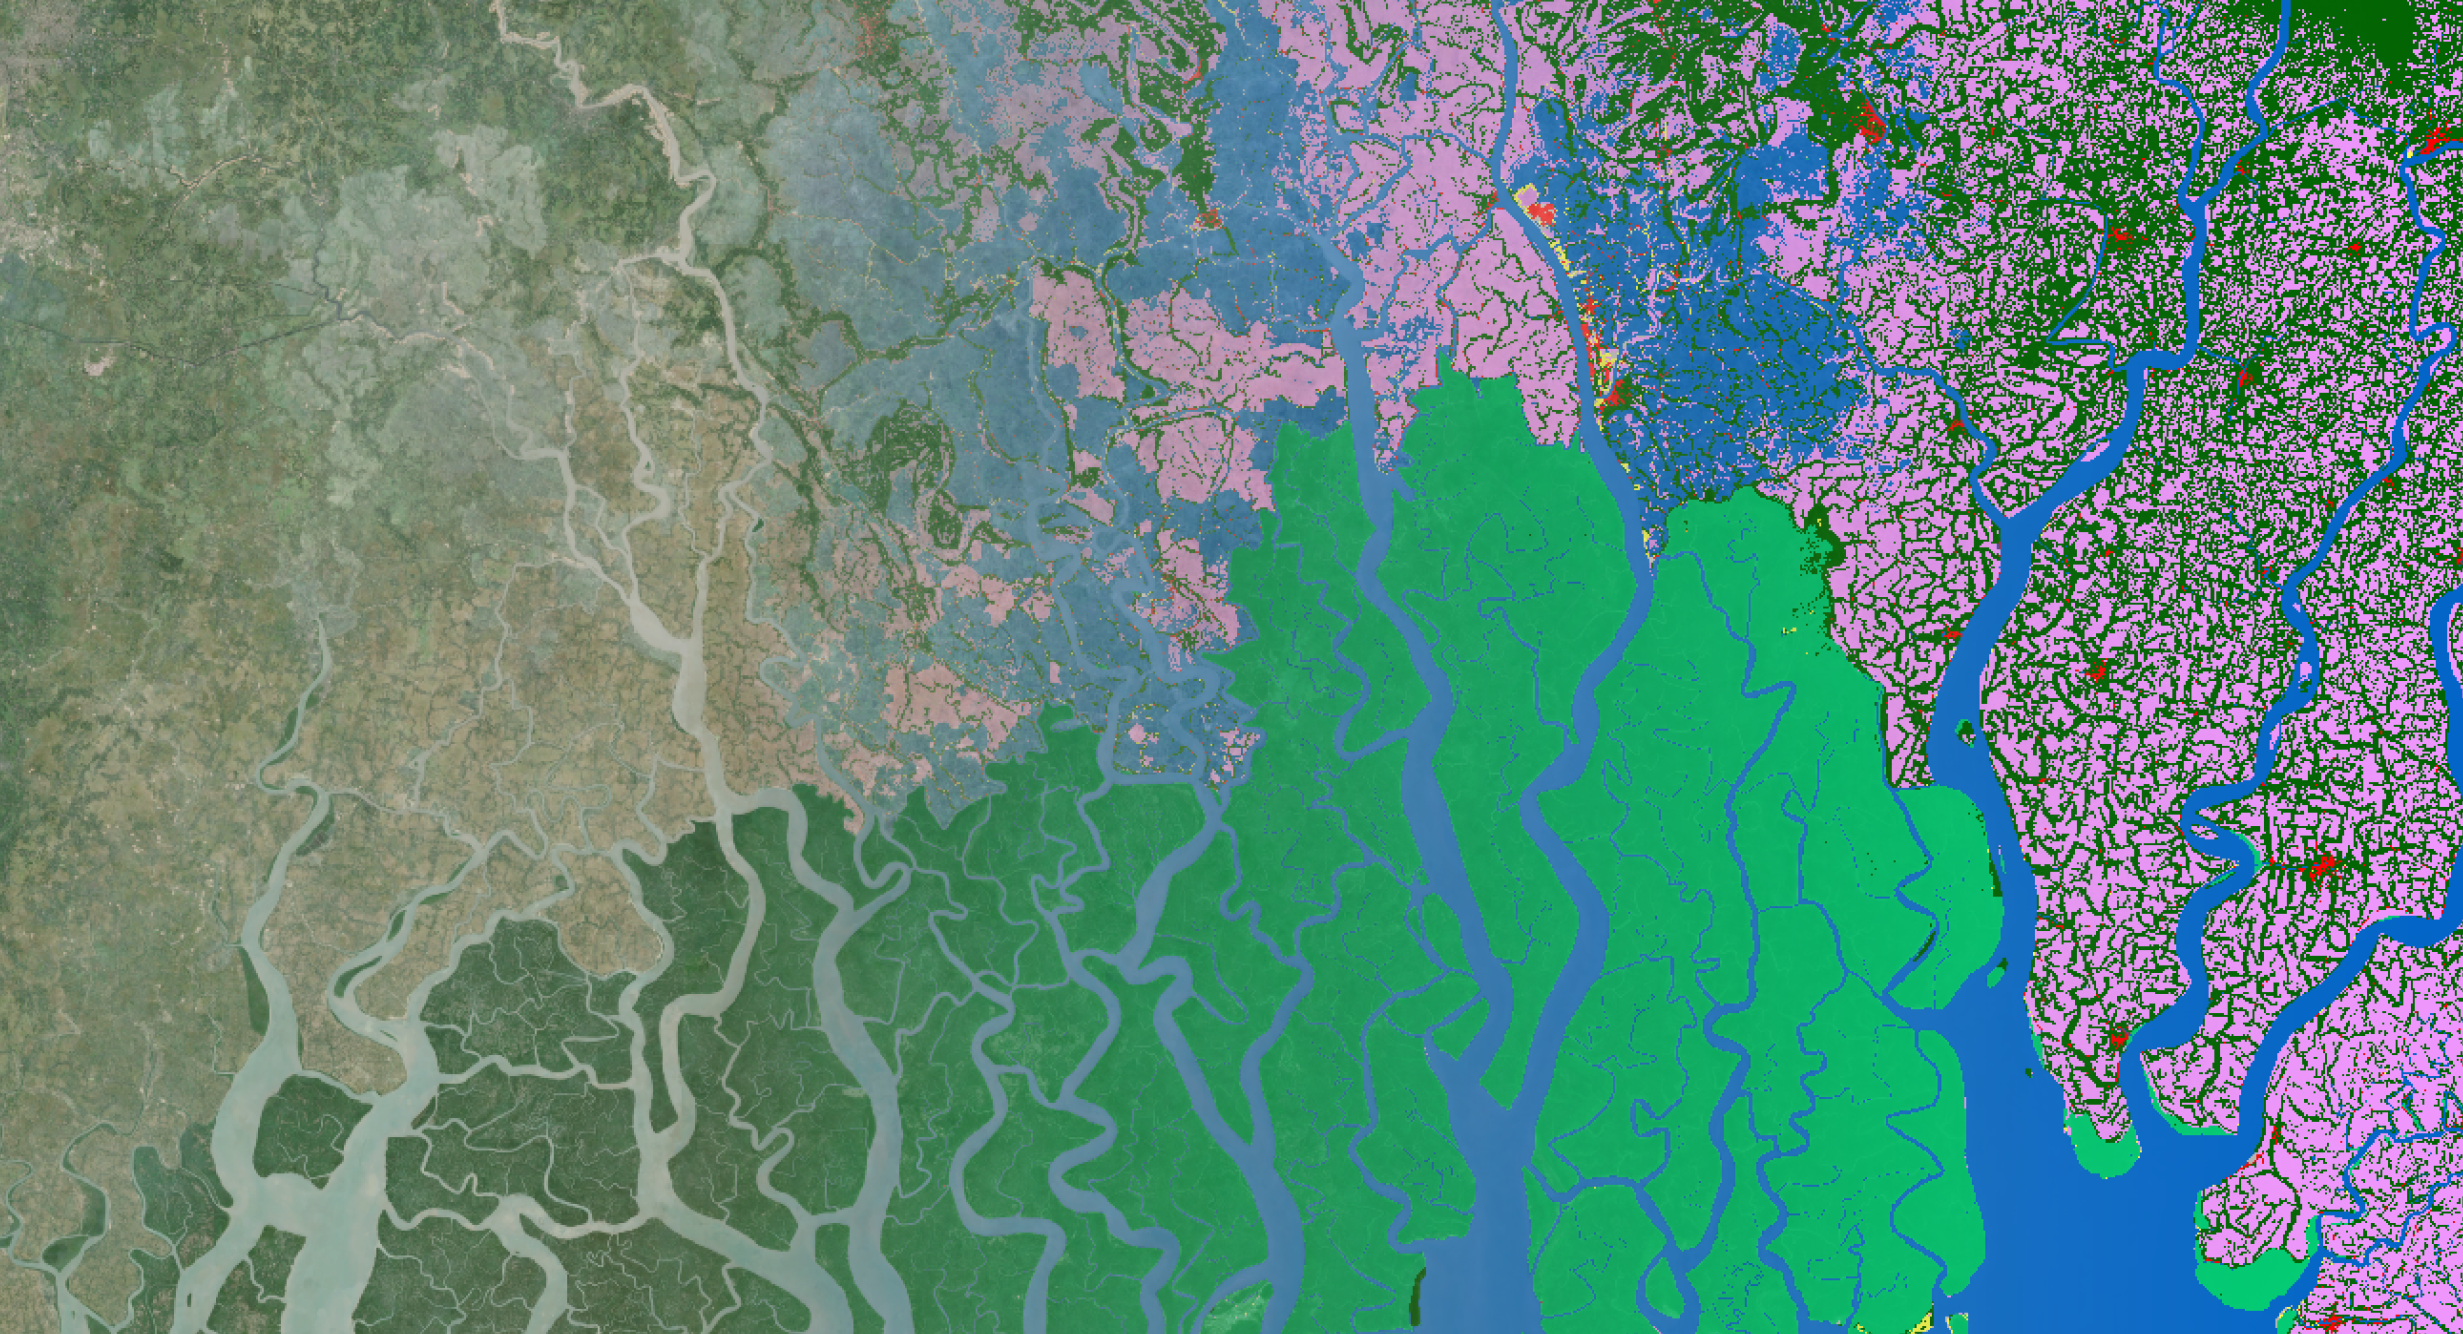
Based on this information, the Water Deficit Index (WDI) can be calculated as the ratio of the seasonal precipitation over the seasonal IET. Low Water Deficit Index values (red/orange in the figure below) indicate additional water was supplied to the croplands, with areas such as the Nile Delta, or Office du Niger in Mali clearly standing out.
Irrigated areas along the Nile, south of Khartoum, Sudan. Light pink denotes rainfed agriculture, dark pink irrigated areas. © left: Google - right: Copernicus global land cover

/Blog%20Post%20Strip%20Cropping%20-%20Featured%20Image%201200x650%20150%20ppi.png)
/Blog_WorldCereal_1200x650.png)