Klik hier voor een Nederlandstalige bericht
Towards more sustainable water exchange
There are multiple examples of large industrial buildings where hundreds of litres of rainwater are captured via the roof but immediately disappear into the sewer. While maybe a few metres further a laundry facility needs more rainwater than it can collect and thus uses tap water to manage their activities. The WaterAtlas, part of the Flanders WaterProof project, offers a solution by which both companies can connect. The laundry facility can easily see which neighbouring companies they could collaborate with to set up a more sustainable solution for its water needs. In this way we realize another part of Minister Demir's Blue Deal ambition to further close water cycles.
The WaterAtlas is a dedicated web-based spatial viewer that locates water supply and demand and indicates where they could be matched to set up alternative water sources. The water supply and demand (m³) are estimated per year for each type of water source and application. Where these meet, there is a hotspot, and thus a high potential for water exchange. The WaterAtlas provides six potential maps and a lot of additional information. Each map shows the potential exchange of either rainwater or purified wastewater with/for:
- Major consumers from industrial and service sector
- Agriculture
- Households
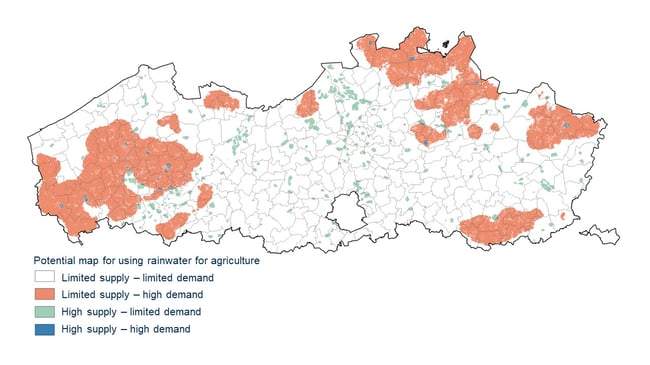
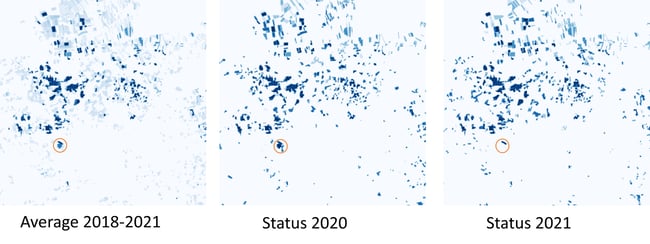
The potential maps show where water supply and demand are limited or high. The blue locations indicate where demand and supply are high whereby large-scale projects are possible.
The WaterAtlas is publicly available to a variety of end users such as governments, companies, research institutions, sector organizations and study agencies. The WaterAtlas also provides additional information such as how much rainwater an industrial site can potentially collect or how much irrigation water is needed to manage agricultural or horticultural plot. This makes the WaterAtlas an interesting platform to accelerate the transition to a climate-robust Flanders and supports many local projects.
From supply and demand towards potential maps
In a first step, we develop maps that estimate the supply and demand of water and sectors for every ¼ ha of Flanders. The annual volume of supply and demand are calculated based on a combination of spatial data and key figures of water use and demand. For example, the amount of rainwater to be captured on roofs is calculated by multiplying the available roof surface with the annual rainfall (of a specific location in Flanders). By adding an additional feasibility factor in this multiplication, we can take into account correction factors such as percentage of roof area available in practice.
The WaterAtlas builds on existing knowledge, insights and data. The demand for irrigation for example uses data from the WaterRadar. But the WaterAtlas also takes into account crop rotation and therefore provides a 4-year average map instead of most recent annual data.
As a next step, the supply and demand maps are further processed in order to correspond to a typical exchange in practice. For example, in the case of using rainwater for agriculture, it is assumed that rainwater can be captured from all suitable roofs within a 1 km radius. While on the demand side, starting from an existing rainwater basin, it is assumed that a pipeline network can transport the rainwater over a maximum distance of 4 km. thereby, taking into account logistic aspects such as the fact that road and sewage infrastructure are most suitable to align the pipeline network with while built-up areas form barriers, etc.
Then, the resulting maps are crossed into potential maps. Where a high demand meets high supply volumes, there is a hotspot, and therefore great potential for water exchange.
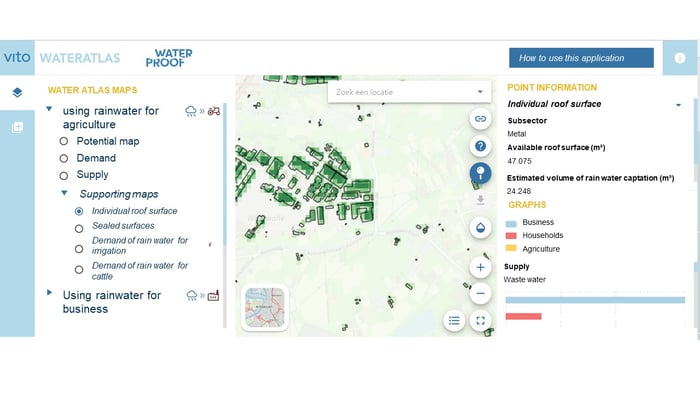
A printscreen of WaterAtlas where you can easily access supply and demand maps, potential maps, and the individual water supply locations including the potential use as well as estimated amount of water in m³ per year.
A hotspot, what now?
Mapping the potential is an important first step. Putting the shovel into the ground is a second pre-requisite to accelerate the transition to a climate-robust Flanders and supports many local projects. This is exemplified in the demo-cases of Waterproof, the Blue Deal project framing the WaterAtlas.
The ultimate goal of WaterAtlas is to inspire local actors to search for more sustainable solutions for their water needs and put alternative water sources into practice. The WaterAtlas provides a theoretical assessment using the publicly available data at different spatial levels. It doesn’t provide information about existing re-use initiatives at the local scale. After locating a hotspot for water exchange, a local analysis is needed to check different opportunities (i.e., exchange with agriculture or businesses) and best possible solution. When investigating the feasibility and setup of a potential water exchange, you can also use tools such as:
- WaterRadar: Agriculture looking for alternative sources
- Waterbarometer: Business level – water balance

The WaterAtlas was developed within the Blue Deal project Flanders WaterProof at the request of Flemish minister Zuhal Demir and was elaborated by VITO with partners based on feedback from water managers, spatial planners and organizations rolling out concrete water projects.