Data access via Google Earth Engine Data catalog
In one of our previous blogs ‘Towards mapping annual land cover changes’ we already announced that we have added more access channels to our Copernicus Global Land Cover products. But making the data accessible is just a first step. We want to make sure the maps can be used and processed to specific needs in a fast and user-friendly manner.
Together with our EO colleagues at Google we looked into the possibilities of using the Google Earth Engine, a cloud computing platform for processing Earth Observation and other geospatial data which is becoming the standard for on-demand EO data processing. By adding the Copernicus global land cover layers in the Google Earth Engine Data Catalog multiple stakeholders can access the maps through Google Earth Engine (GEE) in Pseudo-Mercator and:
- Use the fast and free computational power
- Upload your own data sources and combine these at lightning speeds.
- Use all infrastructure (computation and storage) open and free
- Collaborate with other scientists
- Use data, algorithms, and visualizations
- Use Python and Javascript application programming interfaces for making requests to the servers
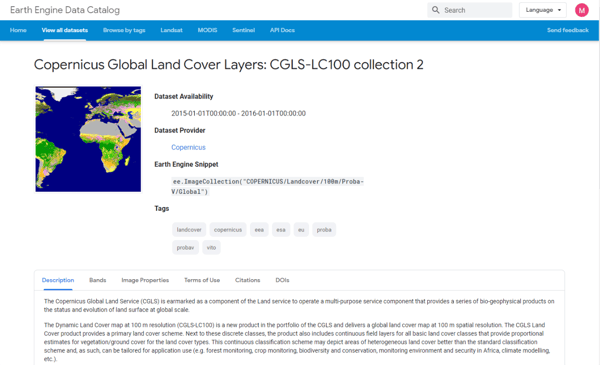
Copernicus Global Land Cover layers in the Google Earth Engine data catalog
With GEE you not only have the possibility to view the data in the highest resolution, but also to perform custom-made analysis and visualizations. Next to our 20 layers in the Copernicus Global Land product, you can use all existing datasets in the GEE Data Catalog as well as upload own data sources to tailor the land cover maps to your user specific needs.
To give you an idea of the unlimited possibilities for regional to continental applications, we designed three examples for applications in forestry and agriculture. And that you can directly start by yourself – we also give you the code with many thanks to my colleague Niels Souverijns for assisting.
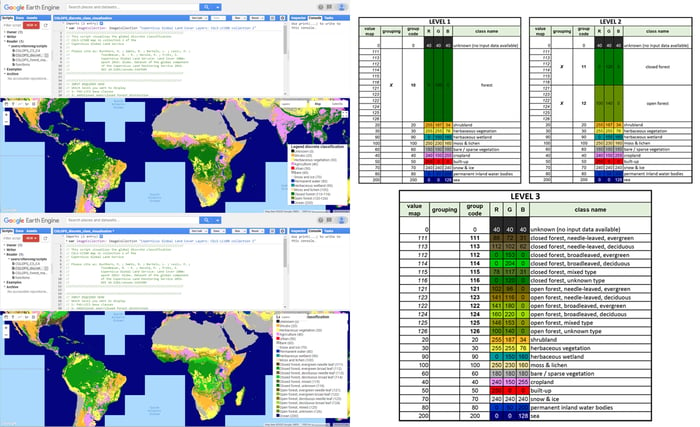
Visualization of the different classification levels
Our standard discrete map in the Copernicus Global Land Cover Layers is distributed in three classification levels. From 12 classes at level 1 and up to 23 classes at level 3, with classes corresponding to the Land Cover Classification System (LCCS) scheme. The following script allows to visualize these three levels of the same data set. We only do an easy switch to the color palettes depending on the chosen classification scheme. Using our example code, you can now easily re-classify our map.
Copernicus Global Land Cover layers in the Google Earth Engine data catalog
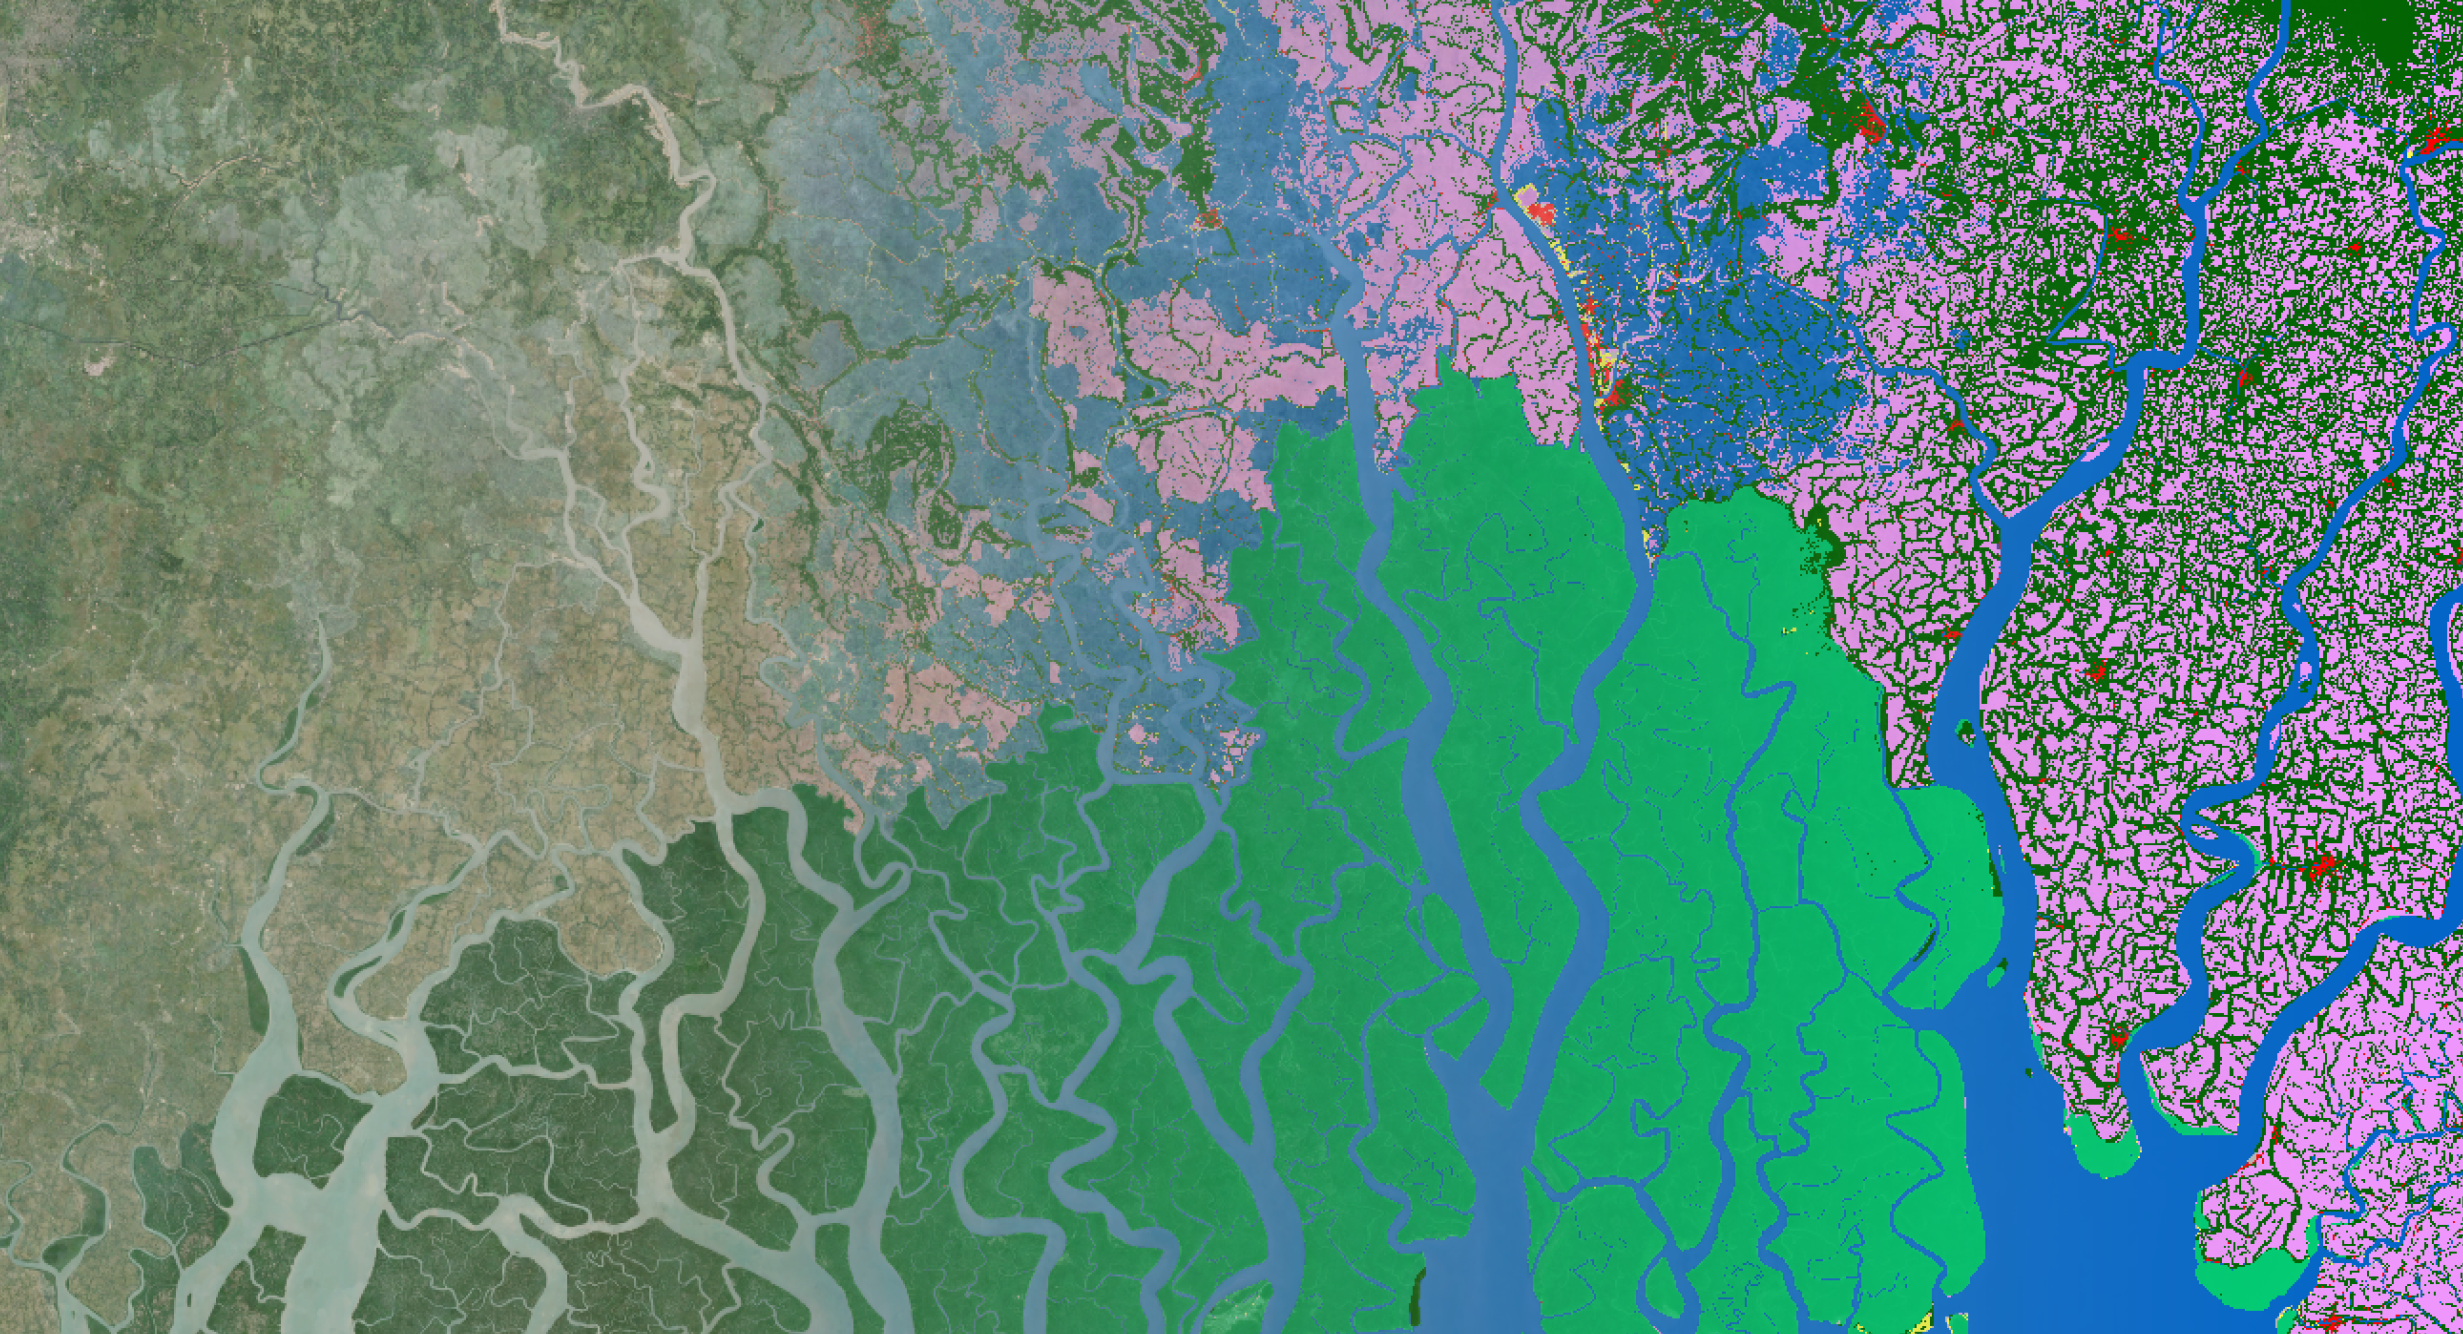
Creating a forest management map
For some applications it is important to use maps which focus on one topic only. In forestry for example, it is not only helpful to know the forest type and cover fraction, but also the forest management practice.
In this 2nd example, we combine layers from our Copernicus Global Land Cover product with a global forest management layer produced by the NatureMap group, a project of the UN World Conservation Monitoring Centre and VITO Remote Sensing. When combining these, you get a detailed 250 class forest management map.
The single processing steps include a reclassification of the discrete map, a grouping of the tree cover fraction layer in 20% steps, and the visualization of the NatureMap layer. In order to avoid confusion, we added a slider so that you can shift between the different layers. Check out the example code for West Africa and don’t forget to use the pixel inspector if you need more detailed information.
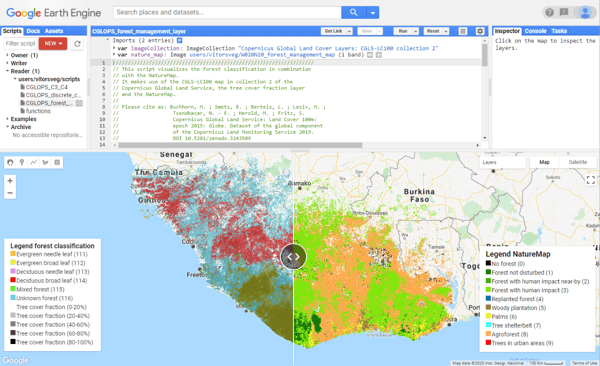 Forest management map for West-Africa in the Google Earth Engine editor
A C3/C4 map for climate modelers
The Copernicus Global Land Cover maps are of course also used to monitor and understand climate change. Climate modelers can create C3/C4 maps which separate plants regarding their metabolic pathway for carbon fixation in the photosynthesis and allows to model the gross primary production (GPP), a major determinant of the exchange of carbon between the atmosphere and terrestrial ecosystems. GPP is a key component of the terrestrial carbon cycle. As the terrestrial carbon cycle plays an important role in global climate change, the better the GPP estimation, the better we can understand climate changes.
In our 3rd example, we generate a C3/C4 plant map for an area close to Sint-Truiden, Belgium. For this we separated the crop class into crop types and uploaded a regional crop type layer from EPR (eenmalige perceelsregistratie /one-time parcel registration), Belgium. Next, we used a look-up-table is to distinguish the pixels with vegetation into C3 or C4 plants. Using the example code as starting point, you can now add models to calculate the GPP out of the C3/C4 map and cover fractions of their distribution.
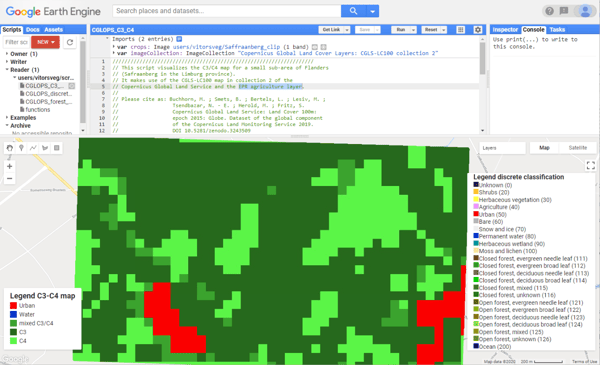
C3-C4 map in the Google Earth engine editor generated for an area close to Sint-Truiden
Explore more and get started
These three small examples only give an idea about the possibilities for regional to continental applications. Feel free to explore more and create your own application or visualization using the Copernicus Global Land Cover layers, and don’t hesitate to share your code or link to the GEE project. We’re always interested to learn from each other.
Stay tuned for more as by mid-2020, after our team performed a full validation, we will also release the annual land cover maps over the full globe. These maps will be available via our viewer and the Google Earth Engine Data Catalog.
By using Landsat and Sentinel-2, the team will even add past reference years and prepare for continuity of this suite of annual 100 m global Land Cover and Change layers.

/lewis-latham-0huRqQjz81A-unsplash.jpg)
/boudewijn-huysmans-_iyh6g5KHQA-unsplash.jpg)