Why map land cover changes annually?
In May, the Copernicus Global Land service released a novel global Land Cover map for 2015, with flexible cover fraction layers making it possible to tailor the maps to the users’ specific needs. With a wide range of user groups, these elastic land cover maps provide spatial information about land for a diversity of applications ranging from global forest monitoring, global crop monitoring, biodiversity and nature conservation to climate modelling, and guarantee high quality products for each user.
In the FAO-funded WaPOR project for instance, this map was extended to distinguish irrigated from rainfed agriculture or the NatureMap group, a project of the UN World Conservation Monitoring Centre, which created a global forest management layer with our support.
Animation showing the combination of the NatureMap's global forest management layer with the Copernicus global land cover layers creating a 250 class global forest management map.
For users looking to map land change processes, such as desertification, de- or re-forestation, urbanization, the impact of major infrastructure developments and so on, it is important to compare land cover maps across different years. The new and additional yearly land cover layers facilitate these processes.
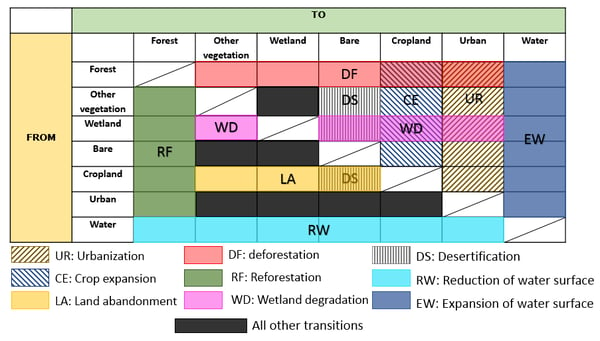 The table illustrates the land cover types and corresponding land change processes as a matrix.
With the help of this matrix, some land change processes could also be subdivided, if necessary, i.e.., drainage of regularly flooded areas for cropland
Land cover changes over Africa
To demonstrate this new mapping approach, we focused on the large and diverse continent of Africa. An interesting test case was the construction of the Lom Pangar Dam in Cameroon in 2016. The discrete maps show that the land cover changed from forest in 2015, prior to construction, to shrub in 2016. After the completion of the Lom Pangar Dam, the 2017 map shows, the resulting water basin and surrounding herbaceous vegetation.
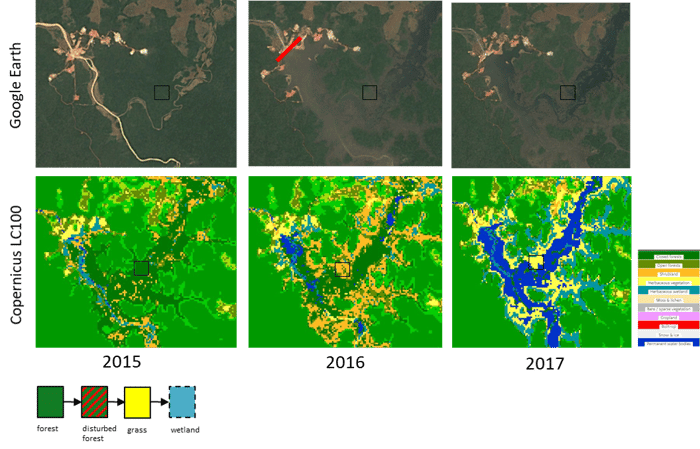
The top row shows the Google Earth Imagery from 2015 (left) to 2017 (right image), with the location of the dam indicated by the red line. In the bottom row, the discrete land cover maps for 2015, 2016 and 2017 show that the forest is replaced by a water basin and surrounding herbaceous vegetation.
The yearly land cover layers are validated according to the CEOS Land Product Validation (LPV) protocol, with a remaining overall 80% accuracy for the LCCS Type-1 classes. Some change processes are already captured well. For others, the change detection methodologies are being improved for the release of the global yearly updates by mid-2020.
Where to find, view & download the maps
Are you interested in these yearly land cover layers, I encourage you to take a look to the brand new Africa Land Cover Viewer and browse through the data yourself. Compared to the existing global land cover viewer, this additional viewer adds a zoom level to explore the maps in their full glory, and allows you to select the year to be viewed on the map and to compare (and export) statistics for different regions and years.
But wait … that’s not all!
In addition to the new annual maps over Africa, we’re adding more access channels for our existing global maps for 2015.
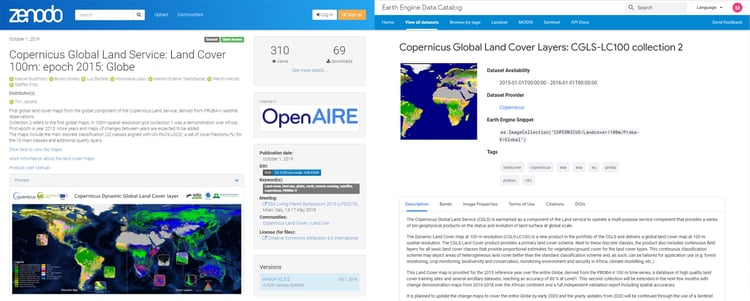
The initial release added a download of 20x20 degree tiles in our global viewer. Now it’s also possible to access the data through Google Earth Engine offering the maps in Pseudo-Mercator through this link (or click here to view the data ), or the single global files on Zenodo through this DOI.
And even more is coming! By mid-2020, after our team performed a full validation, we will release annual land cover maps over the full globe. By using Landsat and Sentinel-2, the team will even add past reference years and prepare for continuity of this suite of annual 100 m global Land Cover and Change layers.

/lewis-latham-0huRqQjz81A-unsplash.jpg)