Monitoring national efforts to combat land degradation
To strive towards a land degradation-neutral world, countries must report their progress on SDG 15.3 and show their efforts to address the global challenge of land degradation, combat desertification, and restore degraded land and soil. SDG indicator 15.3.1 serves as the primary measure in this process as it quantifies the spatial extent of degraded land, making it a crucial tool for monitoring and assessing efforts to combat land degradation on a national scale. Current monitoring focuses primarily on the use of 3 sub-indicators:
- land cover changes
- trends in land productivity/functioning
- trends in carbon stocks above and below ground
Countries currently report on SDG 15.3.1 every 4 years against a baseline period (2000-2015). For countries that have no local datasets on these sub-indicators, existing global datasets (at 300m - 1km resolution) are used. Nevertheless, in numerous areas, these datasets are often considered too coarse to accurately evaluate the complexities associated with degradation processes.
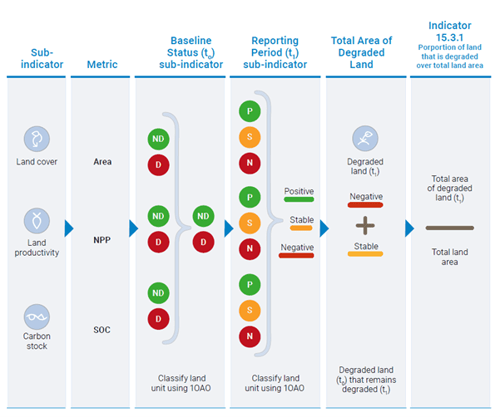 Steps to derive the Indicator 15.3.1 from the different sub-indicators (ND= Not Degraded; D= Degraded), Source: Sims et al.. 2021. Good Practice Guidance. SDG Indicator 15.3.1, Proportion of Land That Is Degraded Over Total Land Area. Version 2.0. United Nations Convention to Combat Desertification, Bonn, Germany
For this purpose, the European Space Agency (ESA) initiated the Sentinels for Land Degradation Neutrality Monitoring (SEN4LDN) project. In less than 2 years the SEN4LDN team is challenged to increase the spatial details of national assessments of land degradation and restoration, and provide synoptic information for countries to plan Land Degradation Neutrality interventions at appropriate scale.
A new robust and automated method
Together with our partners Lund University (Sweden), GFZ (Germany), Wageningen University (The Netherlands) and Conservation International (USA) we focus in SEN4LDN on the following core objectives:
- to develop robust and automated EO methods to map land cover and its changes (robust change detection for LDN) and land productivity dynamics (robust phenological analysis for LDN) at high spatial resolution (10m)
- to investigate methods to integrate these new 10m products with the existing default low resolution datasets
- to develop an integrated open-source EO-based solution to assess land degradation
- to demonstrate the adequacy of the approach in three countries (Uganda, Colombia, Portugal)
Building on robust algorithms and valuable insights
To gain critical insights into the dynamics of land degradation and restoration efforts we must rely on accurate identification and tracking of land cover changes. However, achieving consistent, high-resolution mapping of such changes requires robust algorithms capable of distinguishing genuine changes from model artifacts or errors and from seasonal changes.
For this we aim to leverage the experience and knowledge acquired from previous efforts such as ESA WorldCover, the Copernicus Global Land Service, and RapidAIEO projects. The methods and algorithms developed for these projects and services provide invaluable input that can be refined to address the specific needs related to land degradation and restoration monitoring. Within SEN4LDN we focus on enhancing the robustness of these algorithms by building, among others, on state-of-the-art techniques in artificial intelligence such as Deep Learning.
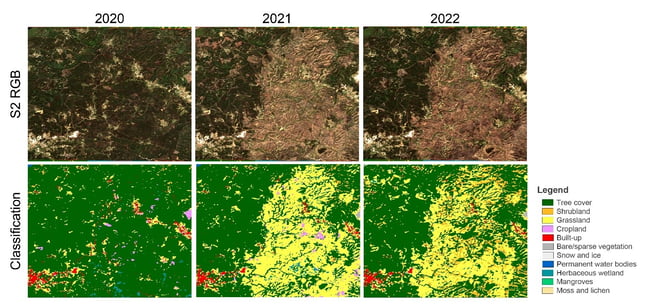 Prototype annual land cover maps between 2020 and 2021 near Coimbra (Portugal), showing the result of large wildfire.
High resolution mapping of land productivity dynamics
To map land productivity dynamics, the SEN4LDN team is building on the methodology developed by Lund University which is also used within the Copernicus Land Monitoring Service (CLMS) to produce pan-European High-Resolution Vegetation Phenology and Productivity products. We use the TIMESAT software framework, enhancing it with methods and functions designed to capture productivity trends. Seasonal productivity parameters, that describe the growth of photosynthesizing vegetation are generated, including the integral over the growing season, the length of the growing season, the amplitude, and the seasonal minimum and maximum values. . Subsequently, trend analysis is applied to detect abrupt and gradual changes in vegetation conditions associated with land degradation at high spatial resolution.
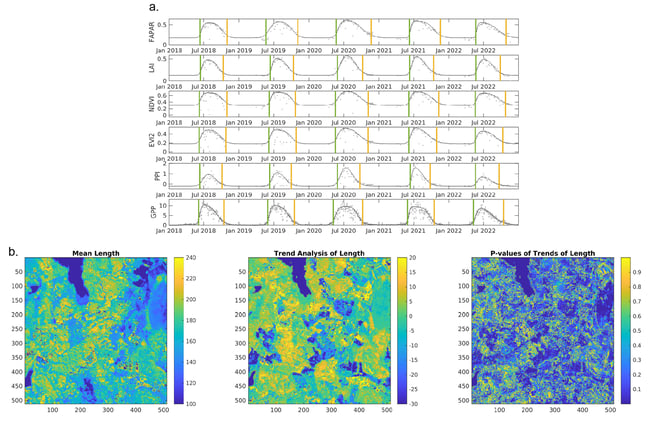
a) Example of beginning (green) and end (yellow) of season dates calculated using the TIMESAT software from several vegetation parameters between 2018-2022. - b) Mean length of the growing season, trend coefficients for the length of the growing season and associated p-values (significance) for a site (Norunda) in Sweden. For trends, higher values (yellow tones) depict longer growing seasons, indicating an overall increase in productivity.
Demonstrate the adequacy with three early adaptors
To maximize and showcase the usability of the new system and generated products, SEN4LDN is engaging with three early adopters. This allows us to demonstrate the adequacy and use via authentic use cases that are related to land degradation neutrality.
- Busitema University (Uganda)
- The Ministry of Environment and Sustainable Development (Colombia)
- The Institute for Conservation of Nature and Forests (Portugal)
They provide access to local calibration and validation data sets and help in defining, validating and assessing the utility of the SEN4LDN products and system throughout the duration of the project.
Easy and open-source access to indicators for different countries
We are currently halfway through the project, actively evaluating the initial results to refine the algorithms and incorporate the early adaptors' feedback. In the upcoming months we will focus on finalizing the algorithms and building a system to monitor and assess efforts to combat land degradation on a national scale.
All processing algorithms and workflows developed within SEN4LDN will be released as open-source and freely accessible. The SEN4LDN team aims to seamlessly incorporate the algorithms and workflows into the established Trends.Earth platform which was developed by one of our consortium partners, Conservation International. This integration will facilitate easy access to all new workflows developed as part of the SEN4LDN project.
So stay tuned for the final results, comprising maps of the various (sub-)indicators for the different countries and open-source workflows!

/lewis-latham-0huRqQjz81A-unsplash.jpg)
/boudewijn-huysmans-_iyh6g5KHQA-unsplash.jpg)