From field level to plant level delineation
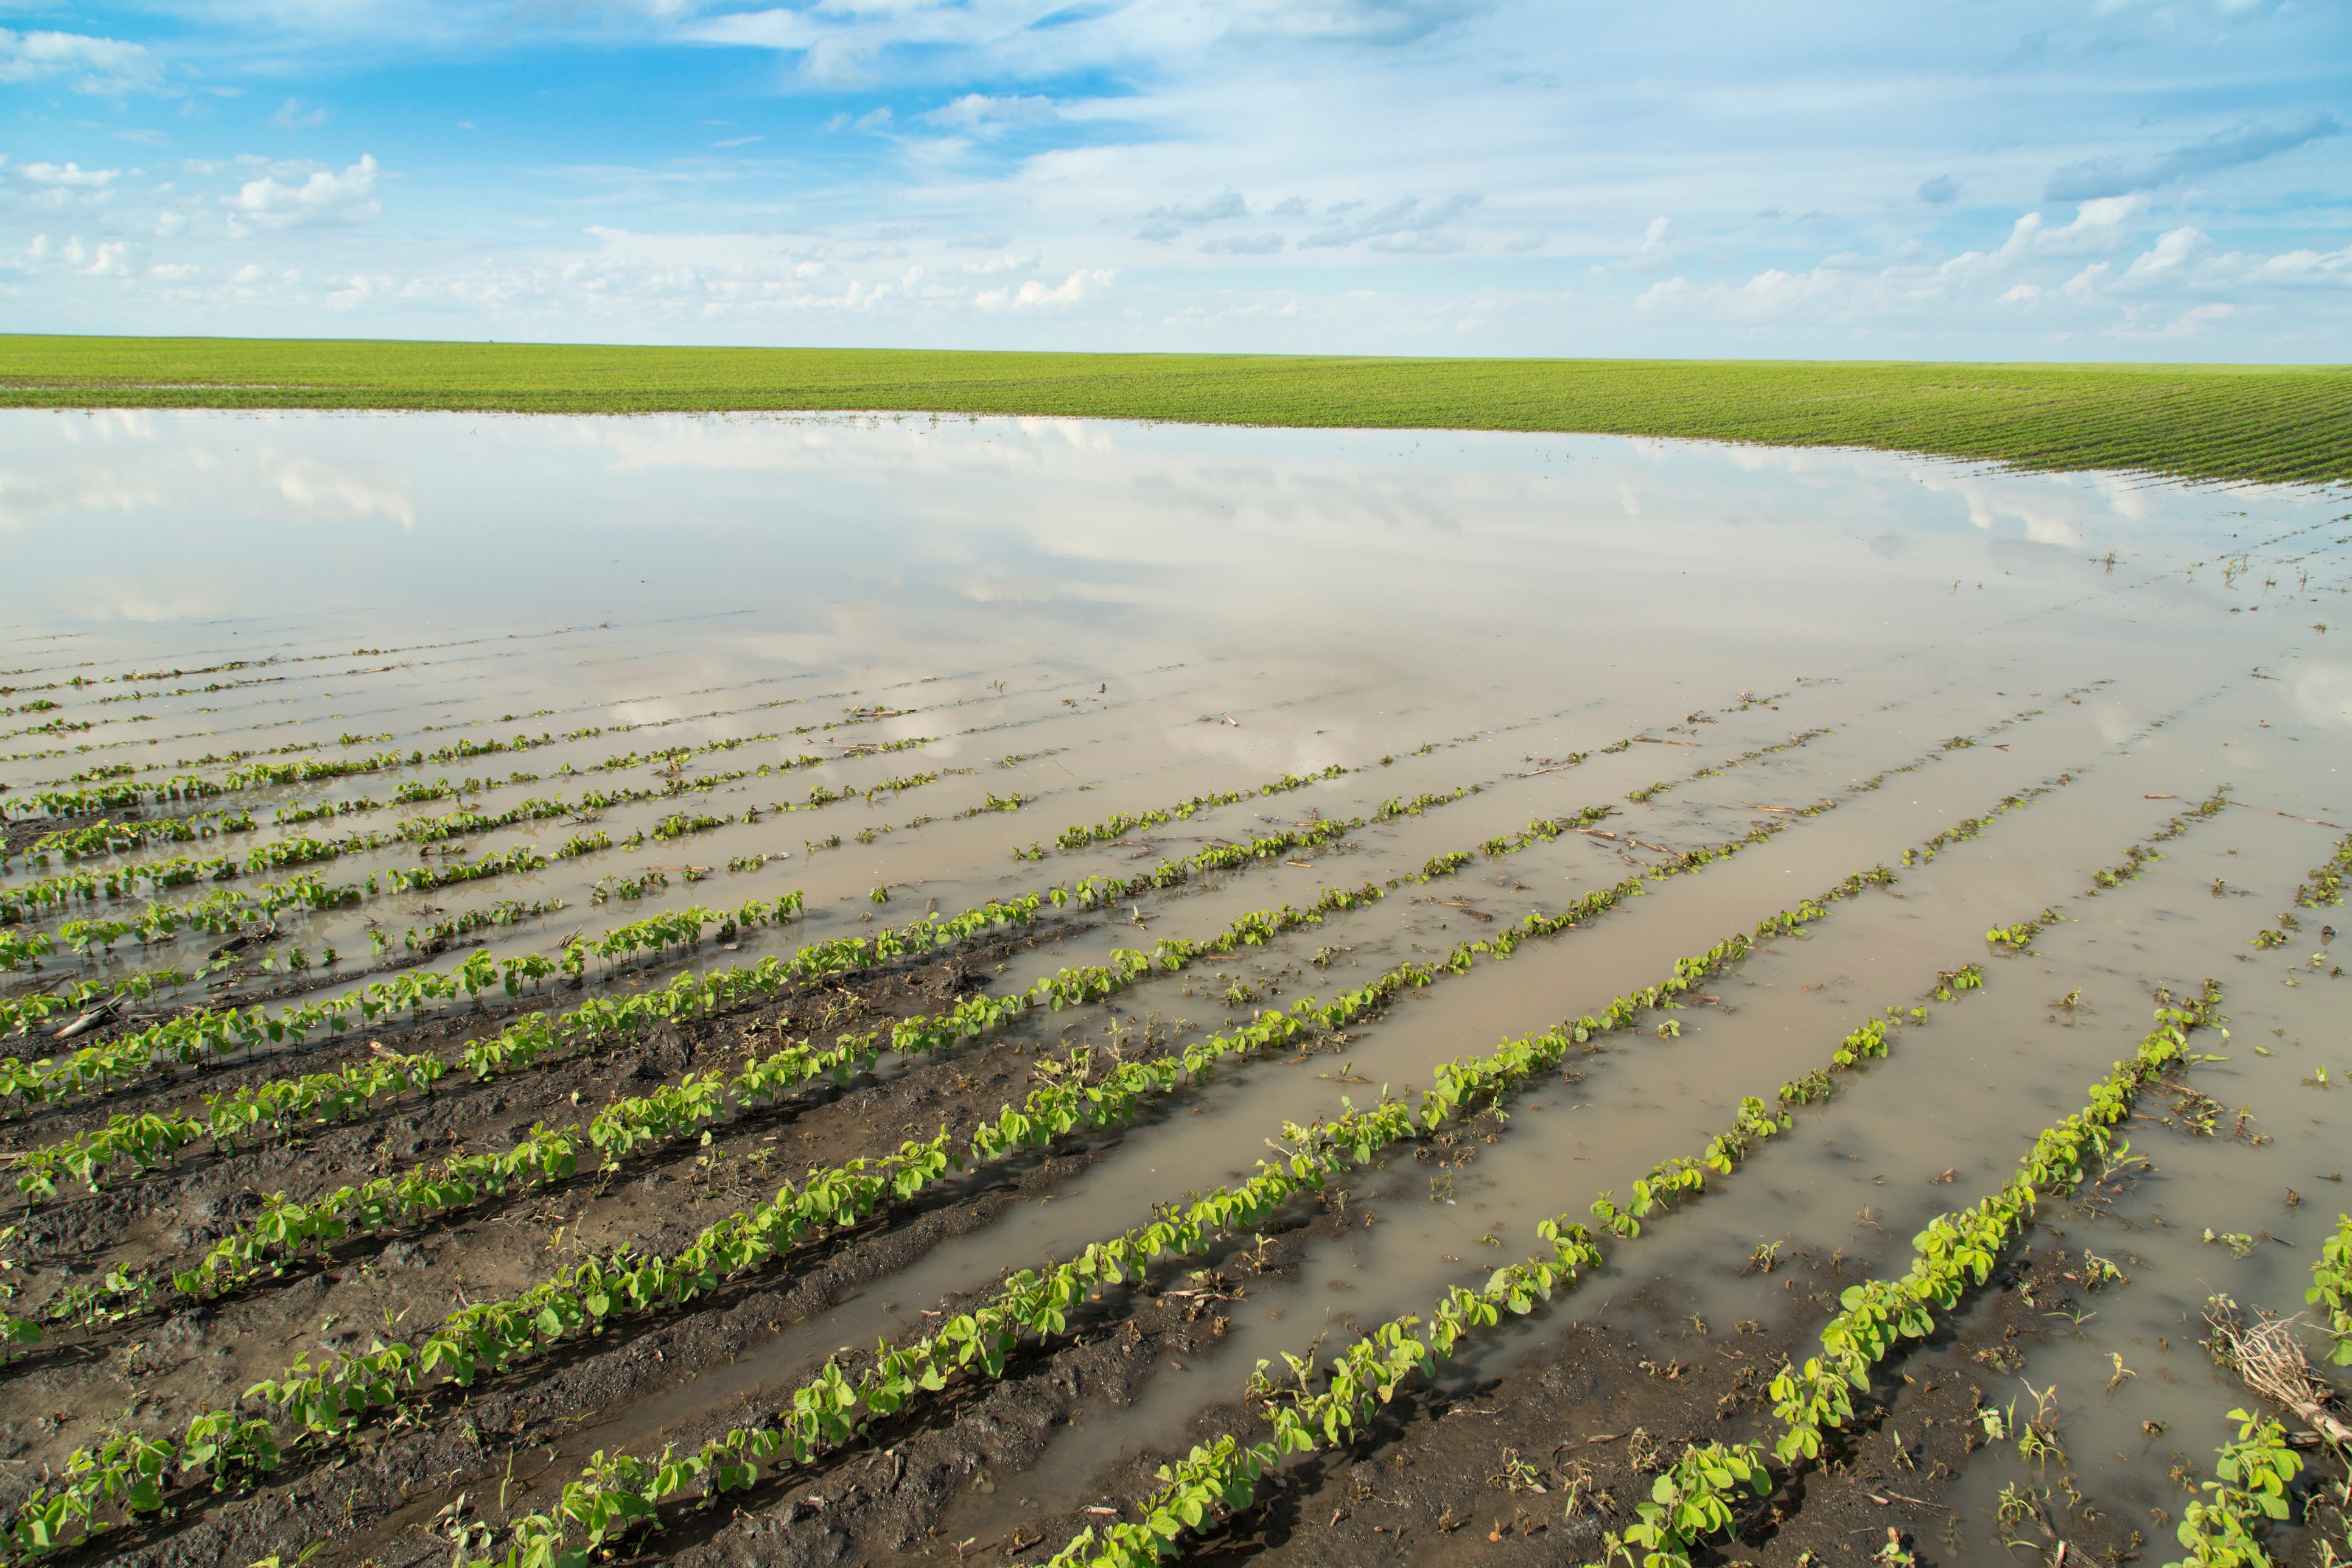
Until recently, drone-based phenotyping focused on gathering information at the plot level. By analysing an entire trial area, we gain valuable and objective information of how different plant varieties interact with their surroundings. However, with the advancement of high-resolution drone technology, which is now more accessible and more powerful than ever before, there are numerous scenarios where it has become both feasible and advantageous to examine plant-level data. This approach is interesting for many applications, in the first place for field trails which have irregularly spaced plots, such as tree nurseries or certain vegetable crops. When we zoom into the example of lettuce breeding, you notice the difference in amount of plants per plot and the variable spacing between them. Some companies will also plant their varieties from one bed to the other in a snake kind of pattern. These plots can now also be analysed by using the plant level delineation, while the traditional plot delineation can be used to analyse large, homogeneous plots.
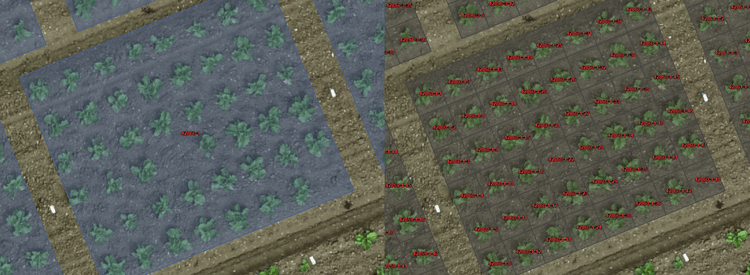
An example of plot versus plant delineation on a lettuce field with the full plot delineation able to analyse how much plant material there is in this plot overall, but not if the plants behave differently.
This new feature builds on top of existing MAPEO features, such as the capability to draw or import user-defined fields and the implemented plant-counting AI algorithms. The plant-level delineation fits seamlessly into MAPEO’s end-to-end workflow. With this new features we bridge the gap for users whose trials are not well-suited to large, homogenous plots; whilst providing statistical outputs at a greater detail than before. Practically, this means that users can now see how a group of plants behave, and also see how each individual plant in that group differs from the others.
How does Plant-Level Delineation Work?
In this new plant-level delineation feature we combine the power of Artificial Intelligence (AI) along with an intuitive interface to match the information in your experimental design with the plants detected in the field. To create the plant-based delineation, following steps are needed:
- Create digital plot layouts by drawing polygons that represent the beds in which the plants are located
- Use the MAPEO plant count product which automatically indicates the location and total number of plants in the given field or plots.
- Match the digital plots (created in step 1) with your plot delineation document, i.e., a CSV file which contains how many plants are sown with the specific plot(s) and all relevant metadata. This allows you to delineate the rows of the plot design on top of the orthomosaic and adapt when plants need to be added or removed.

To match the information in your experimental design with the plants detected in the field, you start by creating digital plot layouts which is possible by easily drawing polygons.
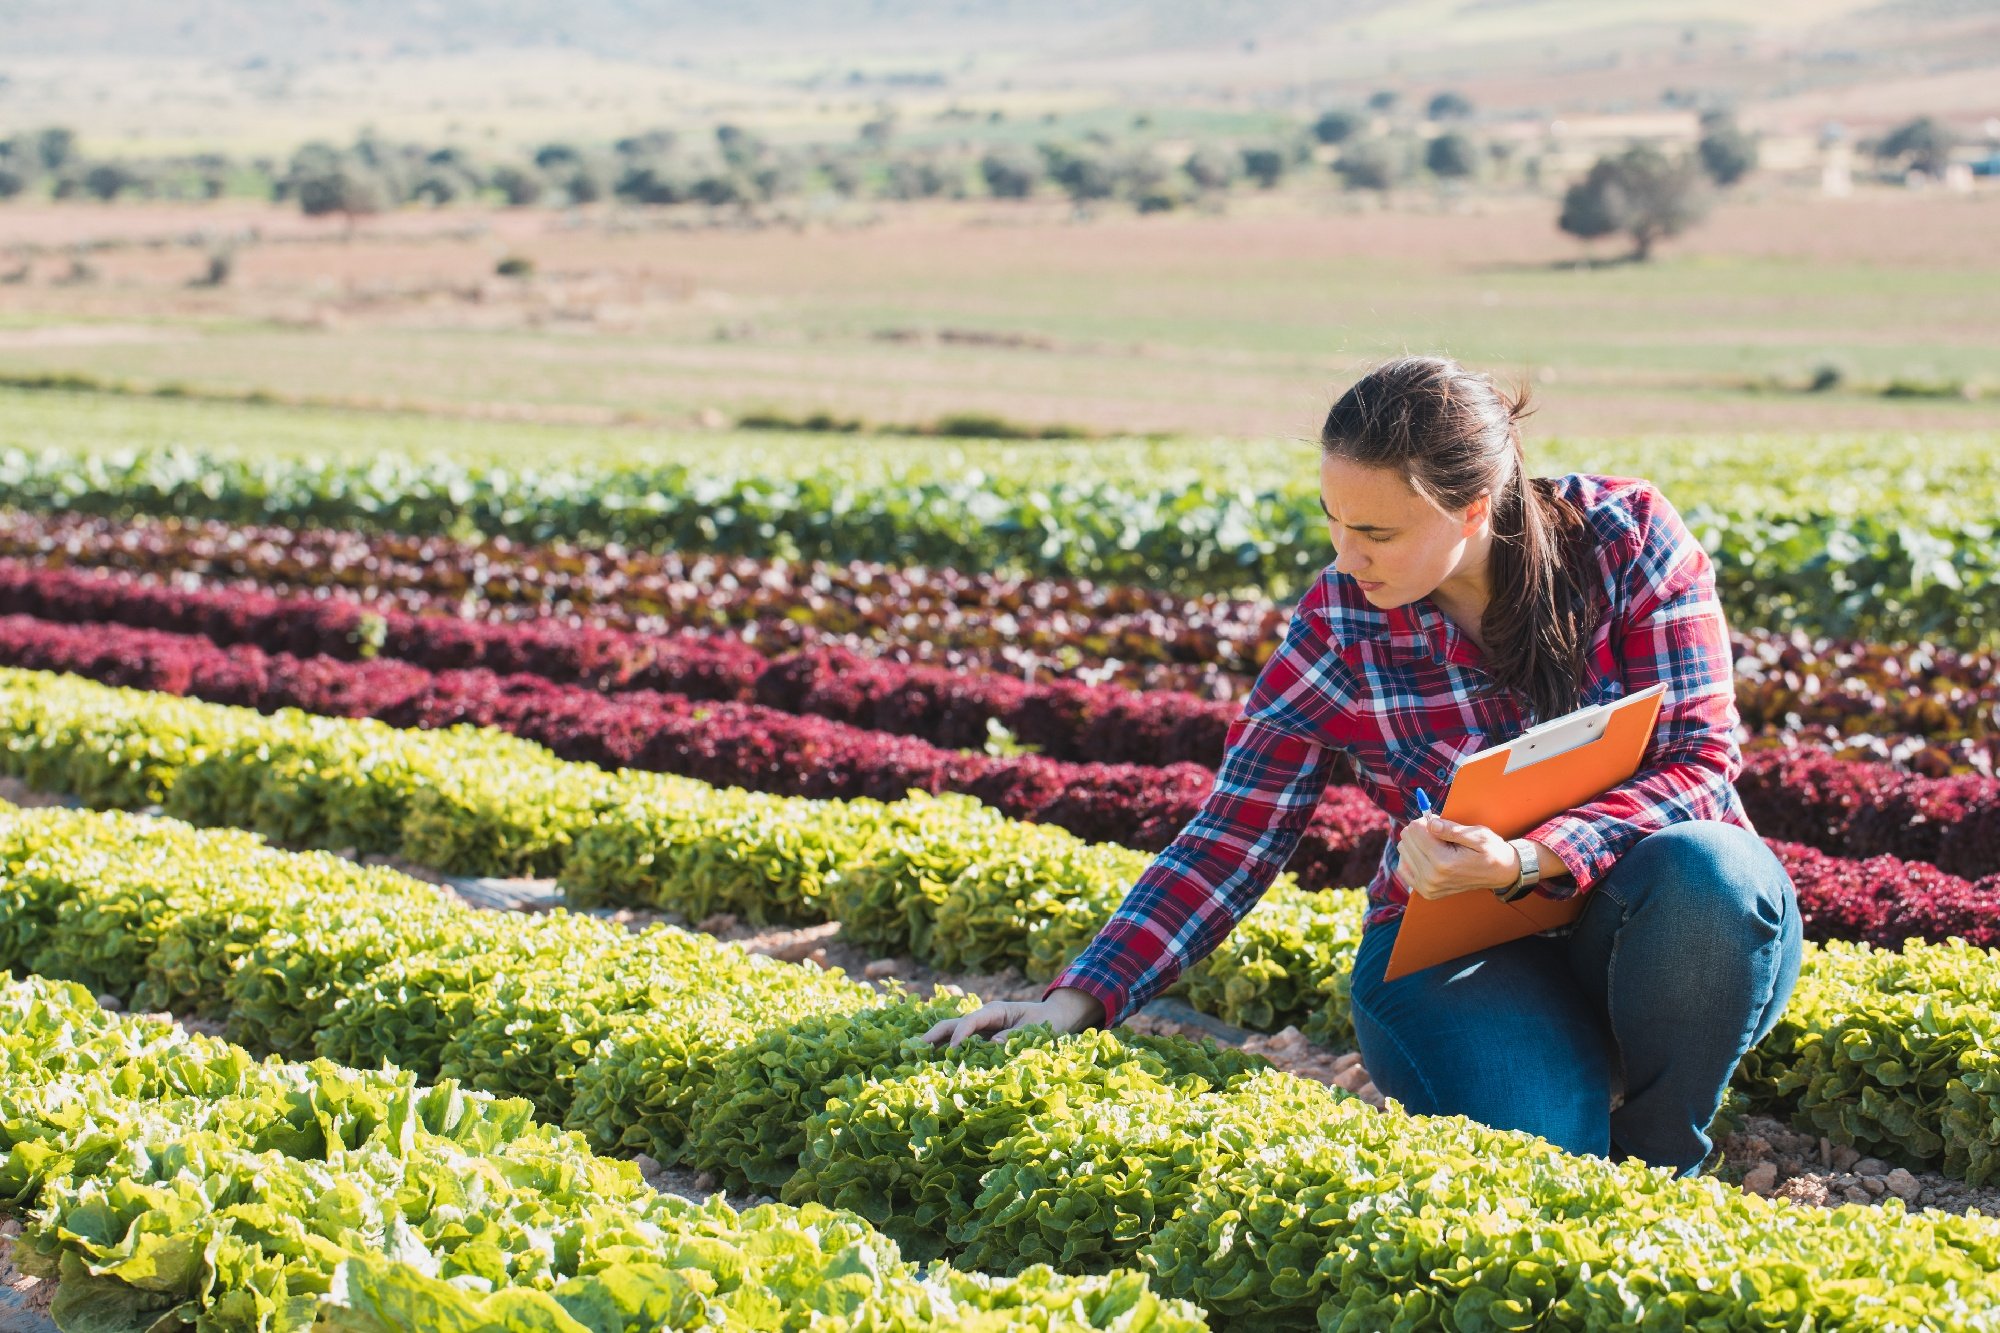
With MAPEO we try to eliminate as much manual and time-consuming tasks as possible in order to support the detection and analyses of experimental fields or individual plants. Although our algorithms can take over 99% of the work, a manual check is still crucial to make sure there’s a 100% match between the amount of plants identified in the drone image and those specified in the experimental design document. By matching the digital plots with your plot delineation document, we can provide an intuitive interface to easily check and add or remove plant objects, either in MAPEO’s digital plot design or in your experimental design document (e.g., CSV file).
Once all input is created and connected, MAPEO will automatically transform the bed polygons into many plant boxes with each box representing an individual plant and assigned a unique identifier based on the user's design information. This flexible and versatile approach is a huge advantage to customize your digital field design for e.g., vegetable experimental fields and opens the possibility to study each plant individually throughout the growing season. More information on how to use the plant based plot delineation is also available in MAPEO's Phenotyping help center.
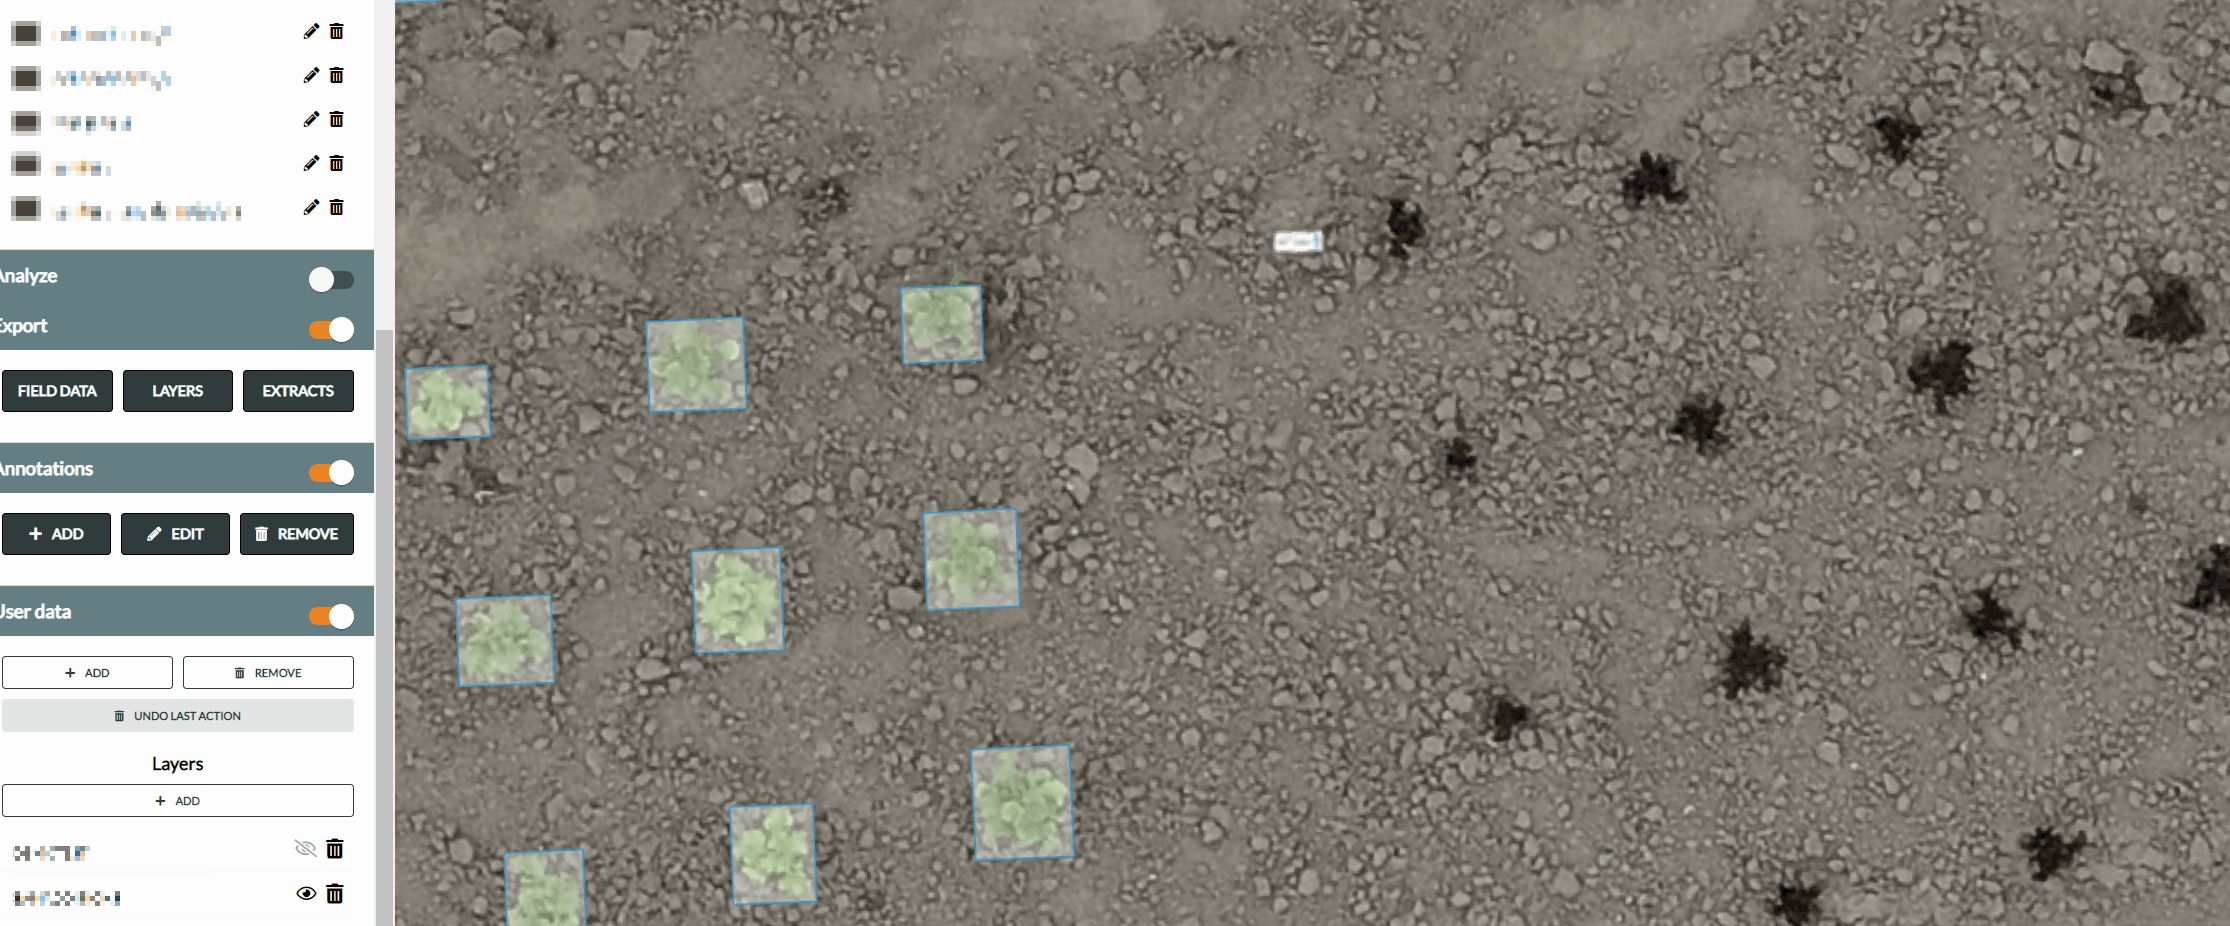
Here you see an example of how you can easily check and add or remove plant objects, either in MAPEO’s digital plot design or in your experimental design document (e.g., CSV file). In this example green lettuce plants are automatically detected, but the red lettuce needs to be matched.
Statistical Outputs Useful with Plant-Level Delineation
When you move from analysing plots to the level of analysing individual plants, you receive an immense volume and diversity of data. This wealth of information gives a broad spectrum of statistical insights that can revolutionize agricultural practices. I give you some examples:
- Growth Uniformity Analysis:
By tracking each plant, you can assess the uniformity of growth within a specific variety or plot, ensuring consistent yield quality. - Health Diagnostics:
By comparing vegetation indices or disease maps across varieties, you can track which varieties are susceptible to disease, and which varieties are more resistant. - Yield Estimation:
Leveraging MAPEO’s object detection capabilities allows for a detailed evaluation of different varieties, highlighting those that consistently yield the highest quantity, largest size, and most valuable harvests. - Phenotypic Trait Correlation:
By observing traits at the plant level, researchers can identify patterns and correlations that might be overlooked in broader plot-level studies.
With MAPEO’s intuitive platform, extracting these statistics becomes straightforward. The platform is designed not only for data capture but also seamless integration into operational workflows, ensuring that every piece of information gathered is easily accessible and actionable for the end-users. Discover MAPEO’s phenotyping platform or contact us to get started and accelerate both efficiency and productivity in your phenotyping applications.