Mapping land cover changes annually on a global scale
The first global 100 m land cover map for 2015 – released just over one year ago – and its diverse access have inspired thousands of users with applications in agriculture, biodiversity & nature conservation and natural capital accounting. Global land cover maps, consistent in quality over the globe and over the years, are urgently needed to detect changes in land cover and related change processes, such as de-forestation, crop expansion or urbanization. Recent developments in EO data availability and processing capabilities now enable us to map land cover changes consistently, with annual updates.
As part of our contribution to the Global component of the Copernicus Land Monitoring Service (CLMS), our land cover team already delivered a first set of 100 m land cover maps, for demonstration purposes, over Africa, for the years 2015-2018.
With the end of PROBA-V’s mission drawing near, the pressure was on to add the year 2019 maps, mapped in near-real time with fewer posterior data, and to extend our land cover change algorithm to the full globe; and to further improve the methodology regarding the temporal stability across years and time series break detection.
Now, 8 months mater, we’re thrilled to release the annual land cover change maps, for the years 2015 through 2019, on a global scale. This new collection 3 includes:
- the discrete map, with the familiar 23 classes
- the cover fractions, the percentage of ground cover for 10 classes, that allow you to build your own, custom land cover classes, depicted below
- the forest type map
- related quality indicators on the input data density
- a new layer showing the reliability of the change detection over time
 The cover fraction layers for the 9 base land cover classes and the seasonal inland water cover fraction.
Examples from the validation and inspection
One of our main objectives to deliver high-quality land cover maps is to ensure the accuracy of the land cover mapping and the stability over the years. With an 80% accuracy target and the CEOS Land Product Validation Stage 4 requirements, the already extensive training and validation data points are revisited and updated by Wageningen University and Research. In addition, the land cover changes were assessed specifically through visual inspection over selected sites and a first, global statistical assessment.


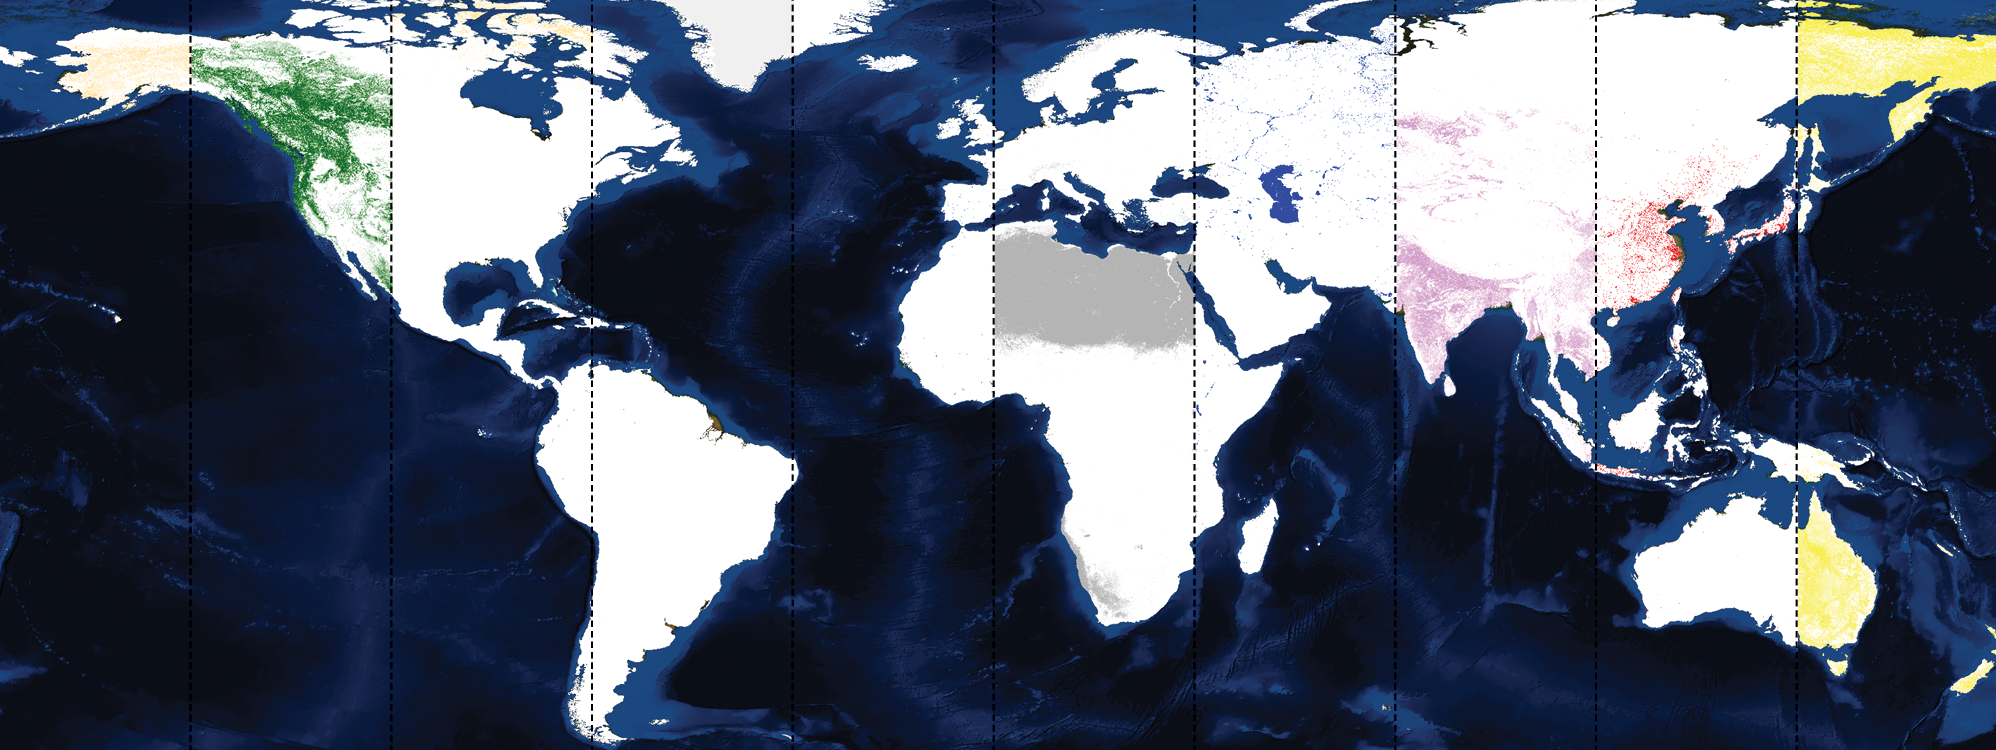
The Continental distribution of the independent validation datasets for land cover (top image, more than 21k points)
and land cove changes (bottom image).
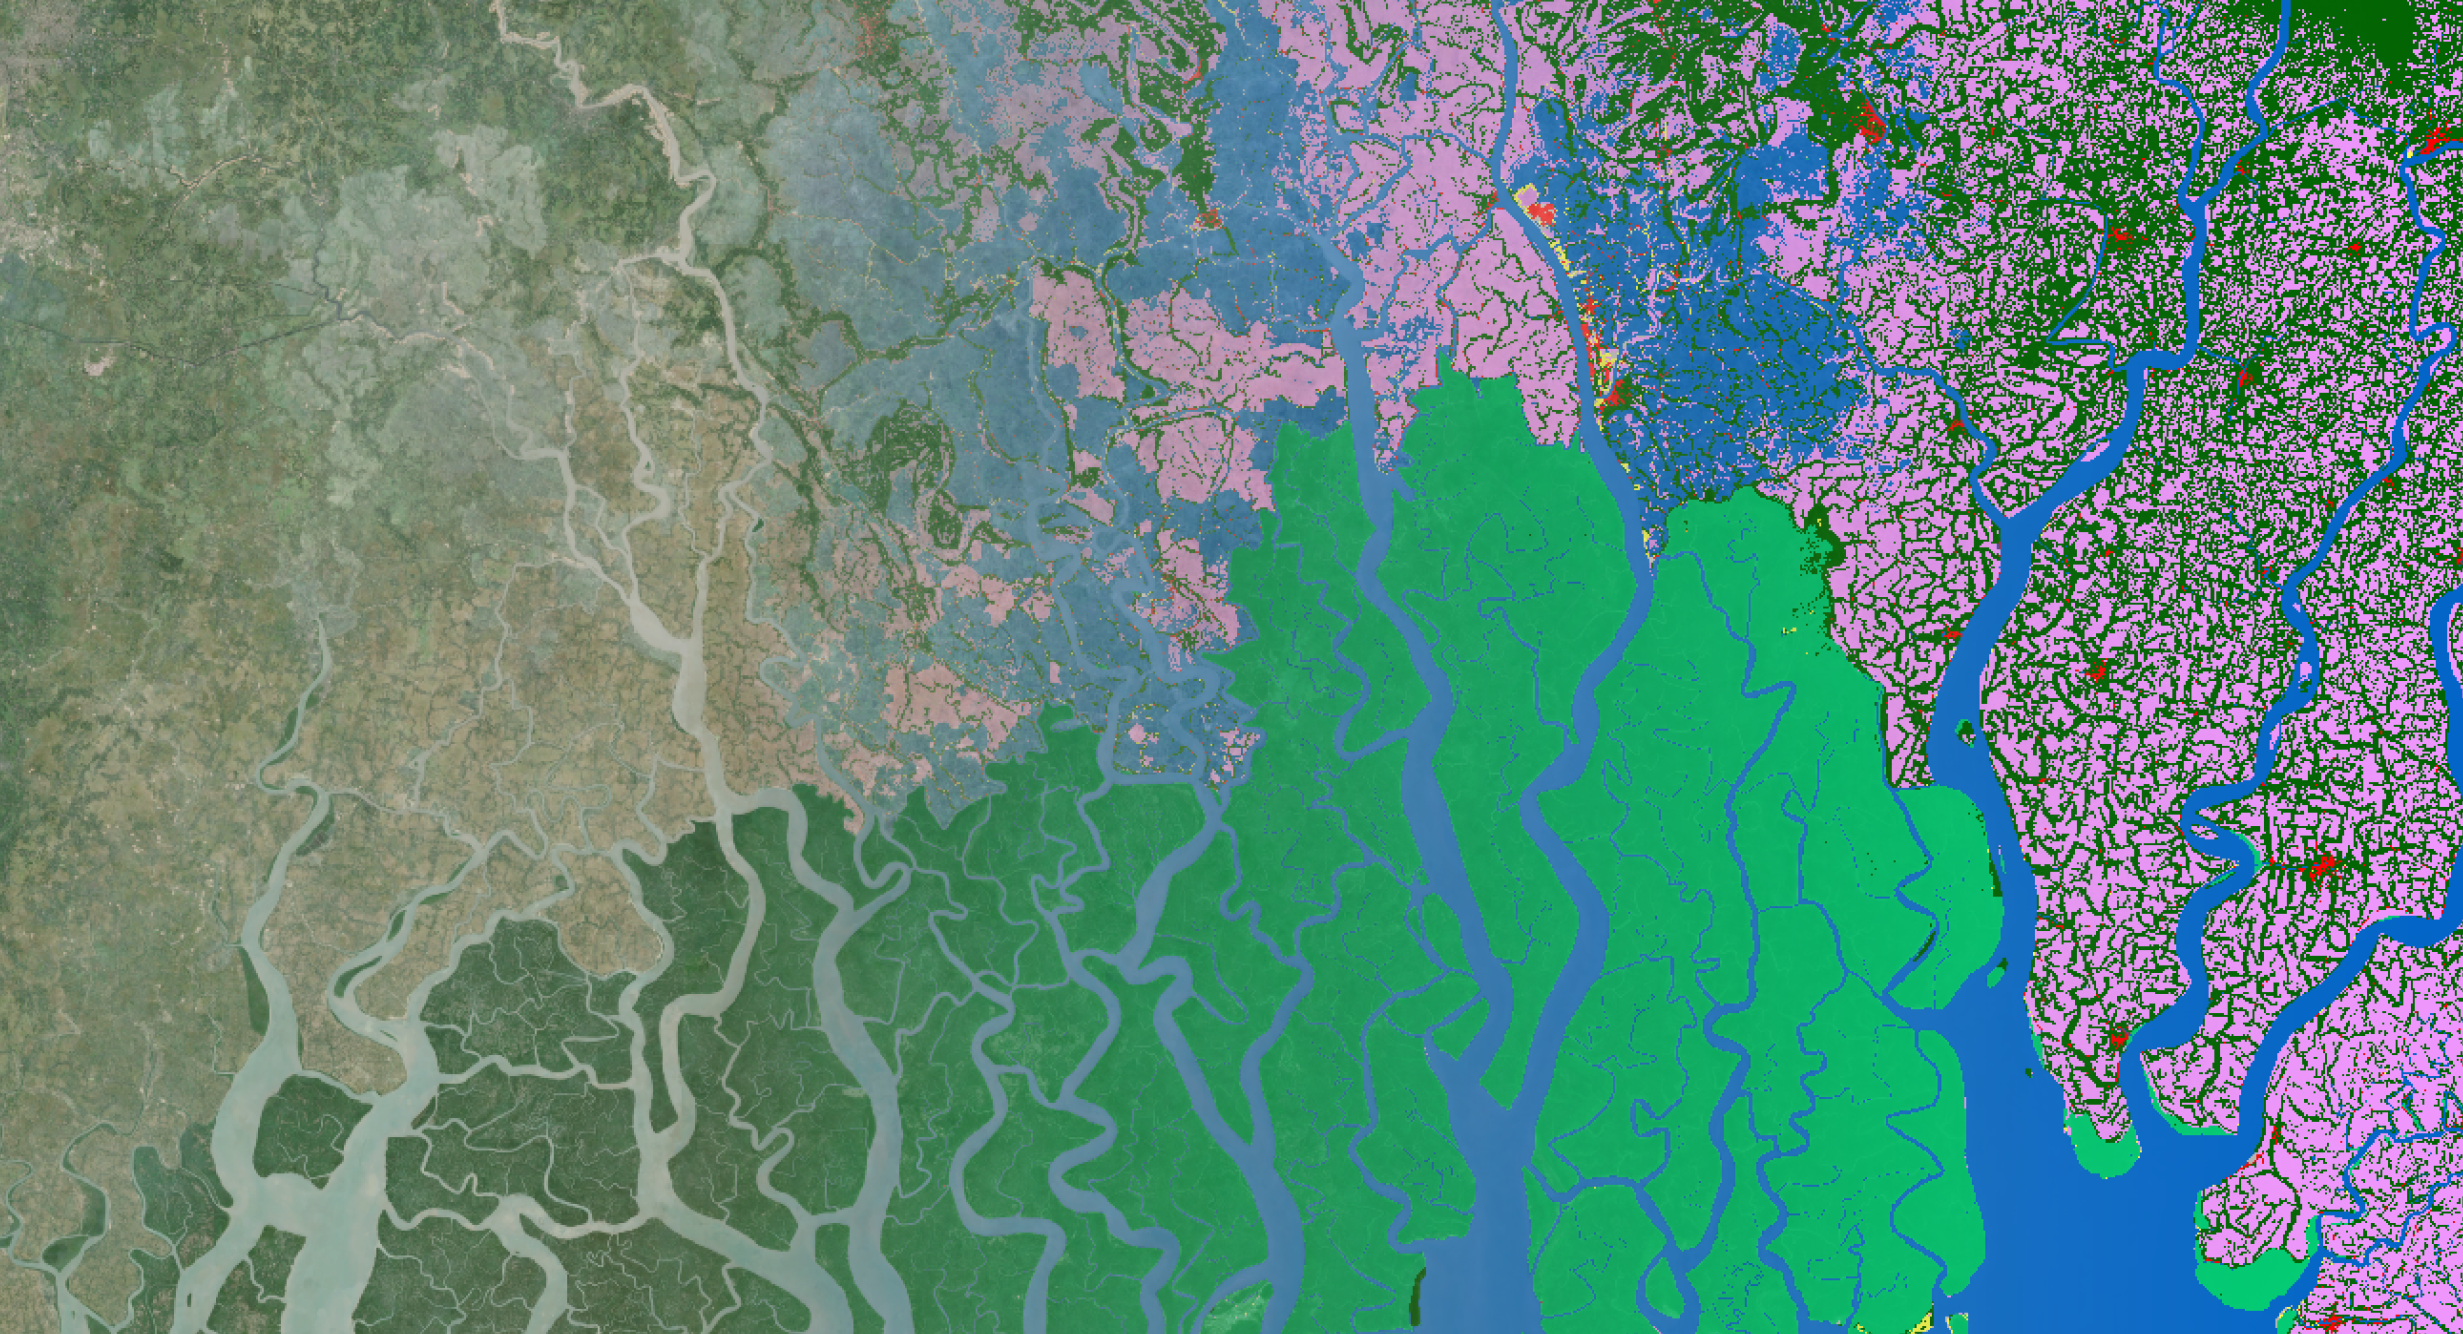
These first example maps clearly showed the annual expansion of cropland in parts of Saudi Arabia, with the typical crop circles. The images below show the annual land cover maps on top (crop class in pink, urban class in red) and the corresponding Sentinel-2 images (RGB 843) below, showing the cropland expansion.
A second example illustrates the loss of forests in Portugal due to the fires in 2018 and subsequent grass regrowth, with again the land cover maps on top (greens and browns for forest, yellow for grass, crop in pink and urban in red) and the Sentinel-2 RGB below.
For consistency, the revised methodology was applied again on the reference year 2015, thereby modestly improving its overall accuracy compared to the previously released version (collection 2) and showing improvements in characterizing forest, cropland and permanent water classes.
Are you interested in using these maps?
Then discover our updated global land cover viewer to explore the annual land cover maps, compare area statistics between countries, regions and years or even download the data as 20x20° tiles, in standard geographic projection (EPSG:4326). In addition, the viewer shows the occurrence of land cover changes, annually or cumulatively over the years, and the change processes.

If you’re more looking for global files or more citation options (Digital Object Identifier), then you can find this on the CERN-powered Zenodo open science platform. As always the detailed documentation including the Algorithm Theoretical Basis Document, the Product User Manual and the Validation Report can be found there as well.
Finally, the global maps are published as assets on Google’s Earth EngineTM (GEE) platform, for analysis and building your own web-viewing and in the Web-Mercator projection (EPSG:3857). Head over to the Earth Engine's catalog or check out our previous blog on CGLS-LC100 map usage examples’.
Users who are looking to compute their own land cover area statistics, or provide feedback can reach out to the help desk. If you’d like to cross-compare to other global land cover data and/or assist in the validation, head over to Geo-WIKI.
Enjoy exploring the new 100 m annual global land cover maps and the updated land cover viewer!
A printscreen of the new Copernicus Global Land viewer, available at lcviewer.vito.be
Related work and coming up soon ...
The methodology has been tested already on using the Sentinels (1 and 2) data to continue the 100 m mapping from 2020 onwards, as well as having the option to move to 10 m resolution maps, as demoed in the ESA WorldCover webinar last week. So we’re ready to continue and extend our annual series in the coming decades. The team has also tested to look at historical land cover changes using Landsat – currently in a Belgian R&D project.


.png?width=600&name=LCmaps_Example_Portugal-Fires%20(2).png)


/lewis-latham-0huRqQjz81A-unsplash.jpg)
