Monitoring water quality of dynamic water
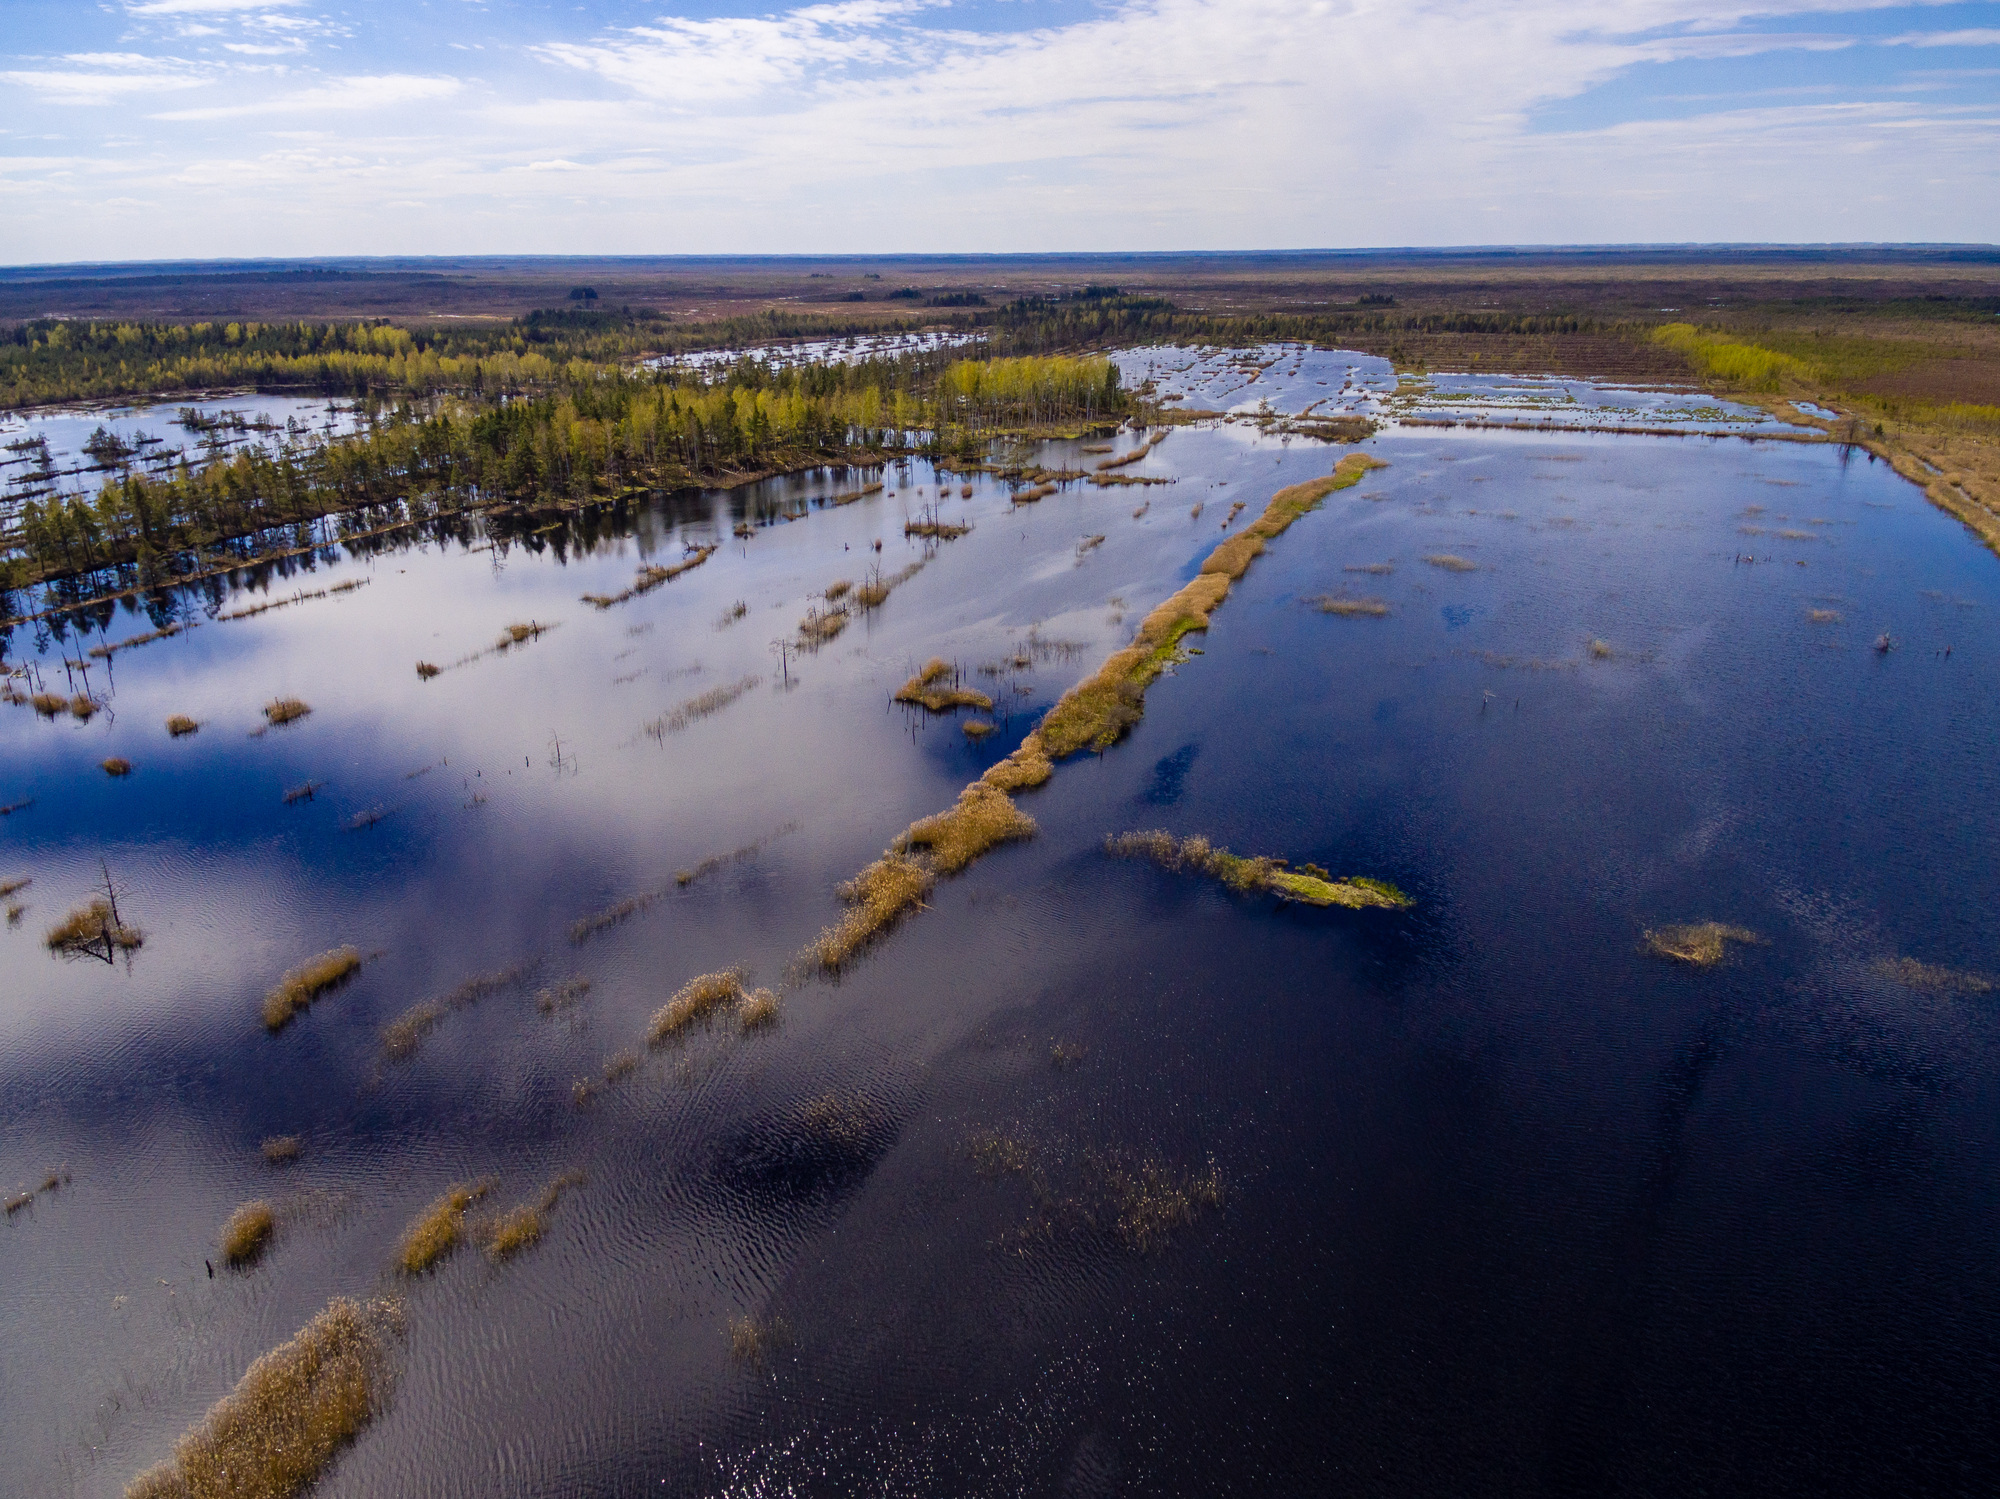
The European water Framework Directive requires member states to monitor water quality aspects related to algae blooms. In the Netherlands, monitoring is performed by Rijkswaterstaat (RWS) with systematic in situ point measurements taken by vessels. However, the complexity of dynamic waters such as the Scheldt estuary and Wadden sea cannot be properly assessed by such sparse monitoring. We are therefore looking into the possibilities of using remote sensing and EO-based solutions. It allows us to collect more data at regular times over large areas which makes it possible to use full coverage maps instead of single point observations.
While monitoring water quality of these dynamic waters, we have to take into account some specific phenomena such as the tides. Do algae and turbidity concentrations shift with tidal phases? This is crucial information when interpreting satellite products. We explored the possibilities and difficulties of using drones and remote sensing technology in a dedicated pilot case.
The ease of use of drone technology
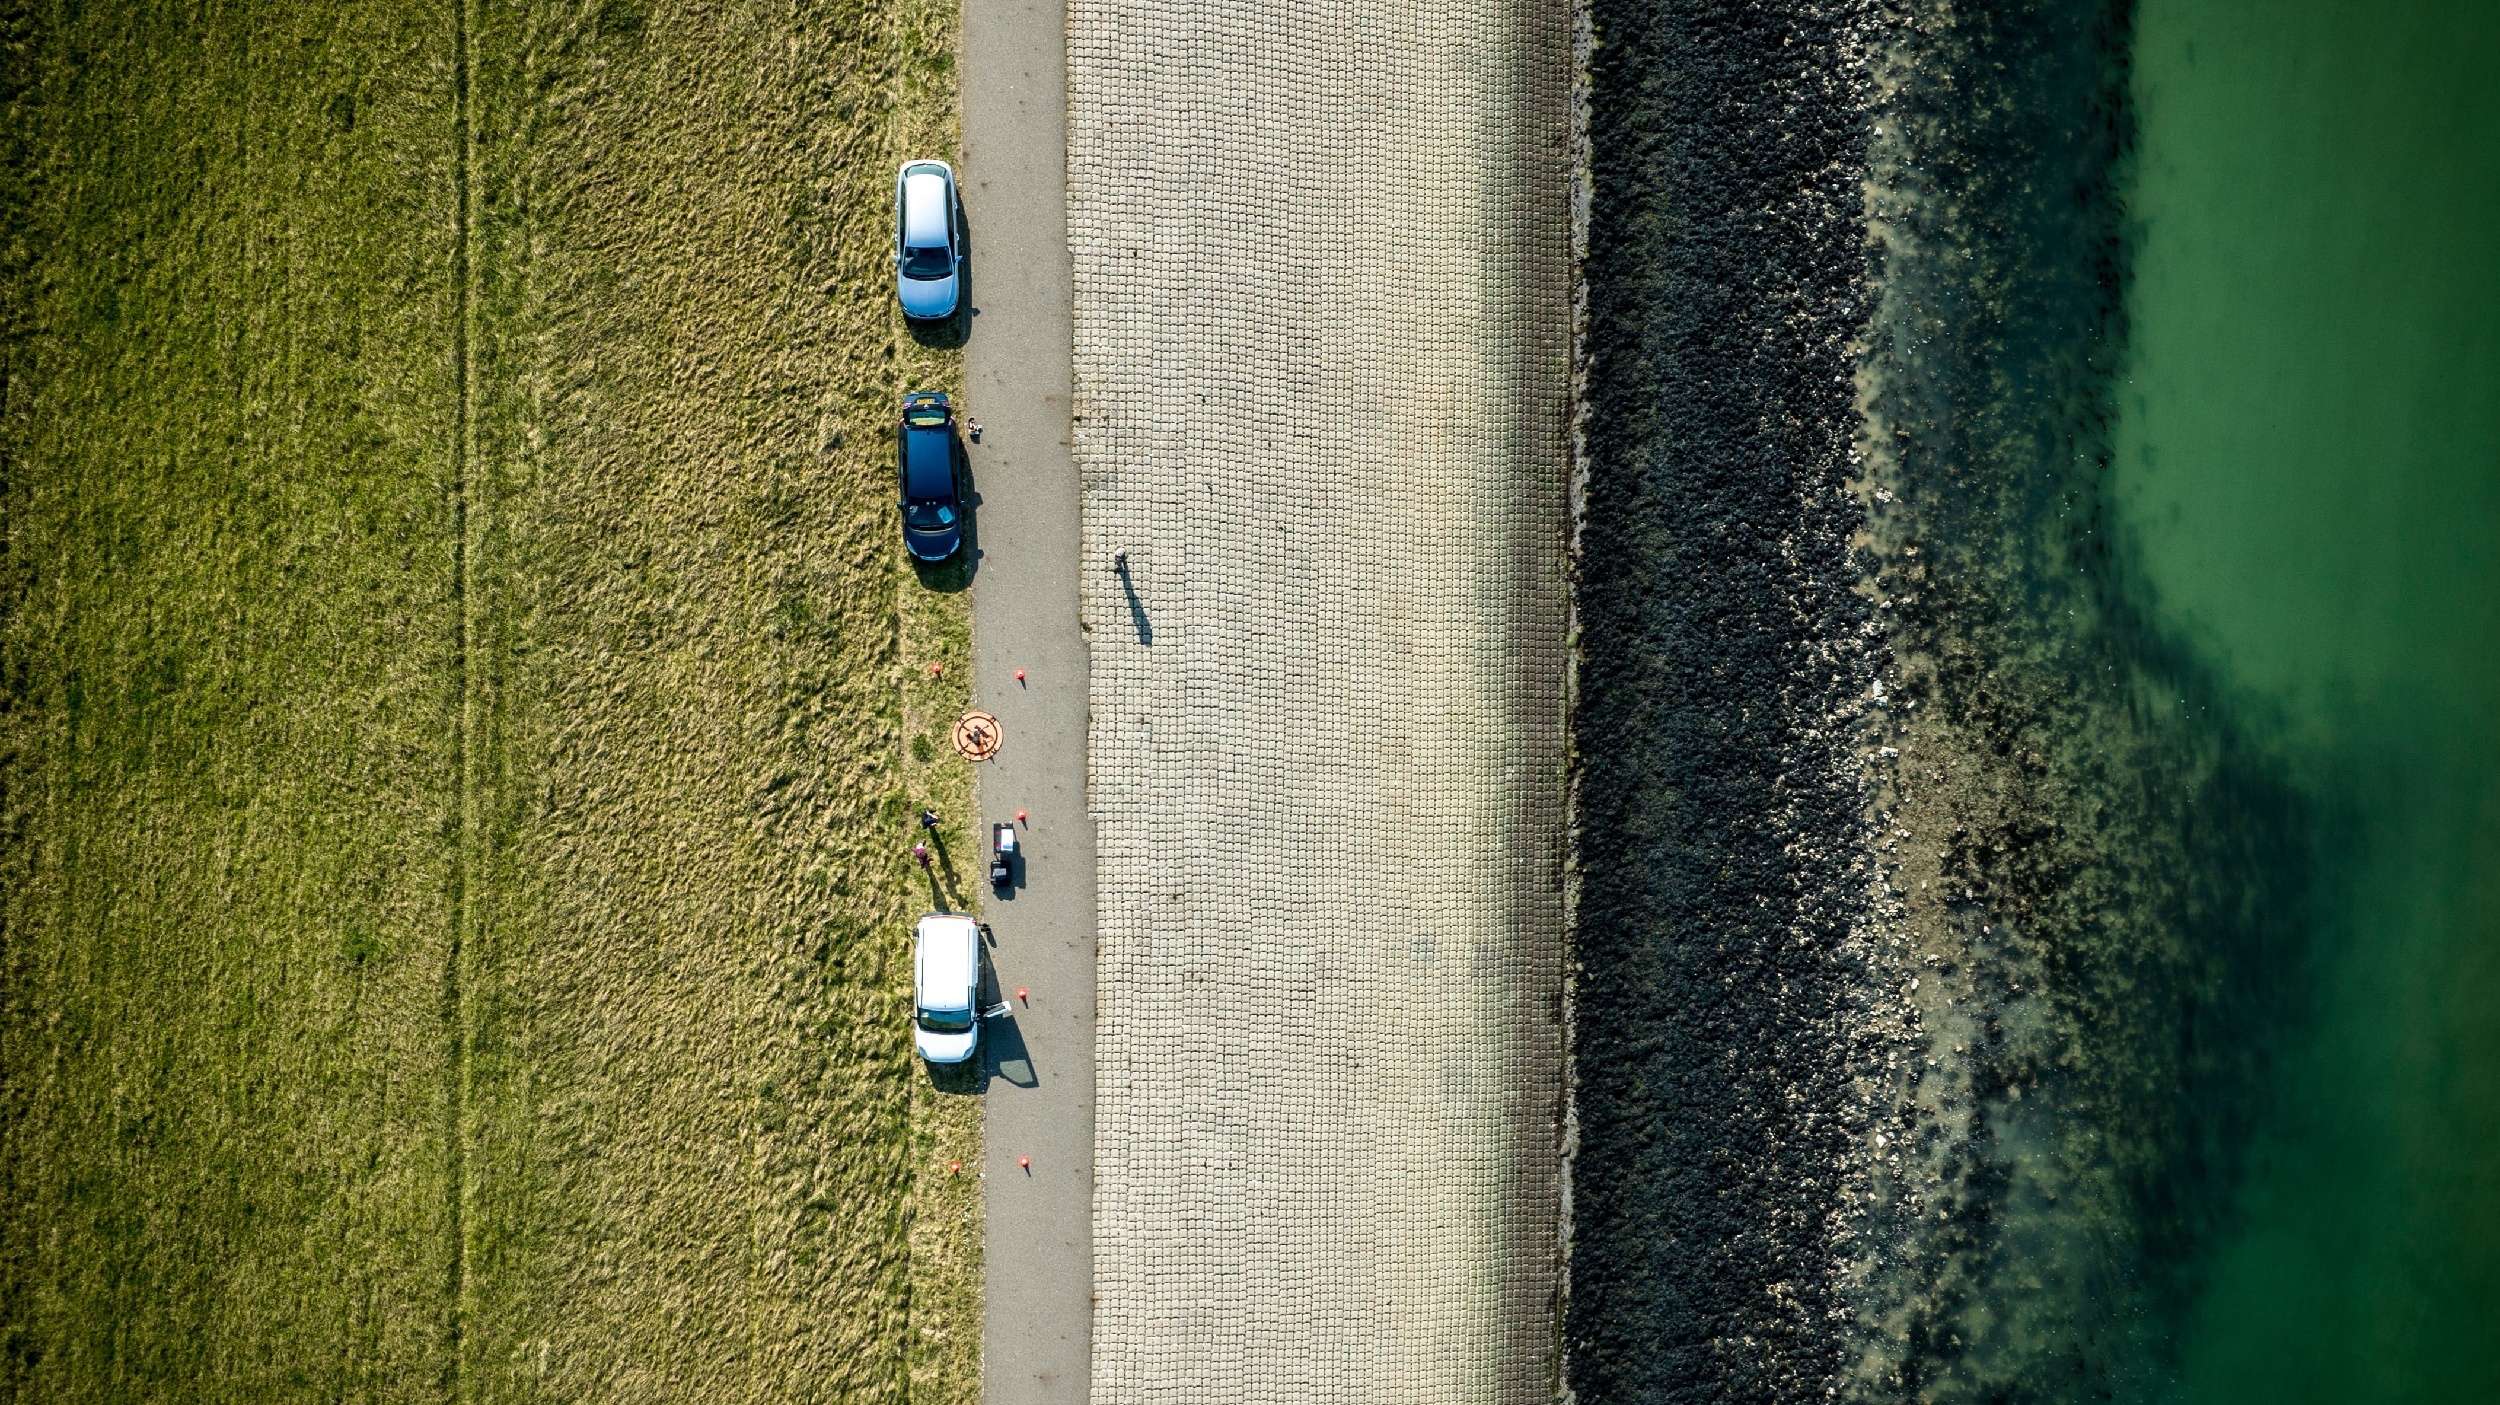
The objective was straightforward: collect optical data every hour at the same location and assess changes in derived biophysical properties between high and low tide. Using drones for optical measurements is not only more efficient than engaging a sampling vessel, we can collect more data over an entire surface. During this pilot case we conducted six flights over a study area in the Scheldt Estuary near Wissenkerke (the Netherlands), of which it was known to have mixed turbidity. Each flight differed one hour and covered approximately one hectare.
To collect the right data, we of course need to use a suitable platform and payload. For this case we used a Matrice 300 (DJI) with a multispectral Micasense Dual Camera Imaging System (Dual Camera Imaging System - MicaSense). All flights were performed according the MAPEO Water Flight Protocols. These protocols are open-source and play a major role in acquiring high-quality data. The multispectral camera registers incoming light in 10 spectral bands with wavelengths comparable to the Copernicus Sentinel-2 satellites. These wavelengths make it possible to calculate water quality products such as turbidity and chlorophyll-a.
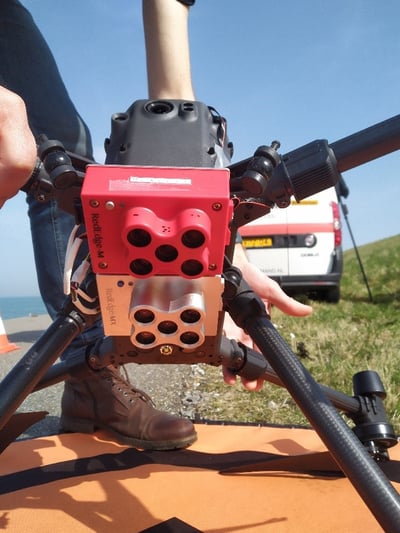
Picture of the drone system with payload the MicaSense Dual Camera Imaging System. Each lens (10 in total) is tuned for one specific spectral band.
In order to facilitate validation of the drone imagery, the 2nd flight was performed while simultaneously in situ matchup samples were collected. Therefore, we arranged that the field campaign coincided with our 2-weekly standard monitoring efforts. When the monitoring vessel passed by, nine additional samples within the drone study area were collected.
From raw data to a chlorophyll-a and turbidity mosaic
Once all flights were performed, all the data was uploaded to the automated MAPEO Water processing workflow via the field software toolbox. Once all data are on the cloud, the processing starts in an automated way taken into account the camera specifications and user-defined processing configuration parameters. Several modules are available and allow to apply different corrections on the data such as (i) radiometric corrections using the fully integrated MicaSense irradiance sensor (DLS-2); (ii) lens distortion corrections; (iii) sky glint corrections on the water surface making use of VITO’s iCOR4drones software. An additional image alignment step is required due to the fact the MicaSense camera has a separate lens per acquired wavelength. In a last step, all images are georeferenced by adopting the information from the auxiliary sensors GPS and Inertial Measurement Unit (IMU). To condense the results in one plot per flight, a dedicated mosaic map is generated from the area covered.
Timelapses of chlorophyll-a
Returning to the primary objective of this pilot, assessing temporal changes in chlorophyll-a and turbidity, the data was analyzed by visualizing time series. The drone imagery was resampled to 10 by 10 meter resulting in a grid of 37 by 25 pixels. For each pixel, temporal values were plotted (blue lines). For each timestamp corresponding to the drone flights, boxplots are shown. Notice that the outer boundary pixels are not included to avoid uncertainty issues.
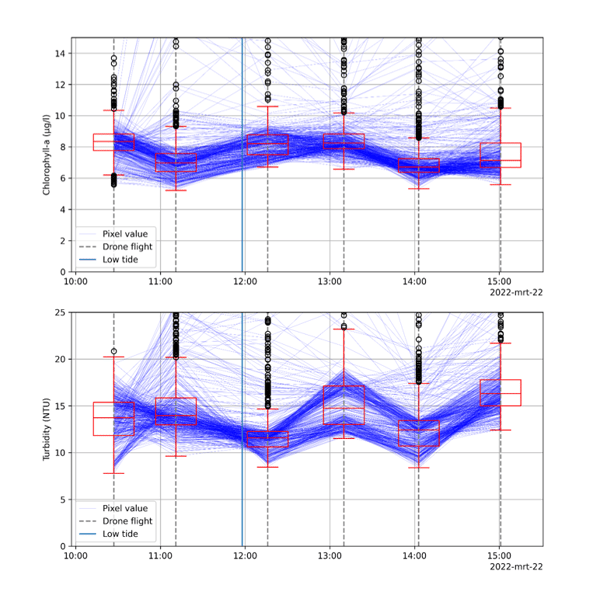
Chlorophyll-a and turbidity concentrations temporal representation
These figures clearly show that there is some significant temporal variation, ranging from 6 to 9µg/l chlorophyll-a and 10 up to 17 NTU. However, it remains hard to define a clear upward or downward trend for this location, in according to the tide (low tide at 11h58 local time). We believe the time window of 5 hours might be too confined to really observe tidal variation as we know that one complete tidal cycle takes 12 hours and 25 minutes.
The importance of combining multiple datsets
This pilot has demonstrated the dynamics of chlorophyll-a and turbidity in the Scheldt Estuary near Wissenkerke. By using drones and remote sensing technology we can efficiently monitor both spatial and temporal dimensions. Solutions based on satellites or sample collected by vessels offer only a snapshot which can lead to a distorted view on the water quality of dynamic waters This must be anticipated when comparing such datasets. With regards to the relationship between the tidal cycle and water quality concentrations, we can conclude that the time window used in this pilot was insufficient to observe significant relations between the tidal cycle and water quality concentrations. Collecting more data and longer time series, and combine multiple datasets are important to broaden the representativeness.
 |
|
| This project has received funding from the European Union’s Horizon 2020 research and innovation programme under grant agreement No 776480 |
|