HISTORIC LAND COVER CHANGES! LOOKING BACK TO SEE THE FUTURE!
Since the release of the Copernicus Global Land Cover Maps for 2015, the land cover team did not rest on its laurels. Apart from static maps for one time frame, there is a community-wide interest in land cover change maps. Within the Copernicus global land service, we are currently finalizing the production of the global land cover change products from 2015 onward at a resolution of 100 m, which will be released by mid-2020.
Next to near real-time land cover (change) mapping, registration of historical land cover changes and dynamics are of high interest to policy-makers and scientists. Apart from better understanding the ecological impact of anthropogenic and climatological impacts, land use changes are considered a vital driver of global environmental change. The Sahel for example has experienced large-scale transitions in land cover over the last decades. A good inventory of these changes is needed to determine its drivers and turning points within this ecosystem. This is the main goal of the UTURN project.
LAND COVER MAPS FOR THE PAST, PRESENT AND FUTURE
Up to now, most of our land cover maps have been produced using PROBA-V satellite data. But when we want to produce maps before and after the PROBA-V era, we have to consult other satellite data sources. That’s why we are adopting our land cover classification workflow to other sensors as well in order to achieve land cover maps for the past, present and future.
- Landsat at 30 m resolution within the UTURN project for historic observations
- PROBA-V at 100 m spatial resolution as part of the Copernicus Global Land Service
- Sentinel-1 and Sentinel-2 in the context of ESA’s WorldCover project for global land cover maps at 10 m resolution
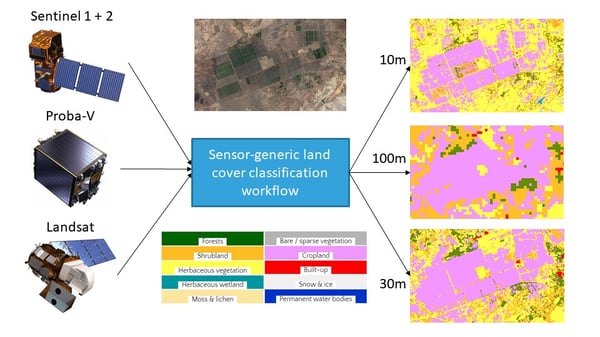
Sensor-generic workflow developed by VITO remote sensing to achieve land cover maps at different spatial resolutions for different time periods. Details about the Copernicus land cover classification workflow can be found in Buchhorn et al. (2020).
Landsat provides a continuous mapping record since 1972. By feeding this satellite data into our land classification algorithm, we can produce 30 m resolution land cover maps for the past.
The large data record of Landsat is available on the Google servers and has been partly preprocessed using Google Earth Engine. Colleague Marcel Buchhorn already shared some examples on how to use the Copernicus land cover maps in Google Earth Engine so you can use and process the maps to your specific needs.
Despite the available Landsat record since the seventies, a large number of data gaps is present in earliest Landsat missions, compelling us to use data composites for these time periods (White et al., 2014). This approach allowed us to create independent land cover and fraction cover maps of the Sahel for the period 1984-2015. The Hidden Markov Model is subsequently applied on the full time series of land cover maps, in order to achieve temporally consistent and coherent land cover products, and erase illogical or spurious land cover changes (Abercrombie & Friedl, 2016).
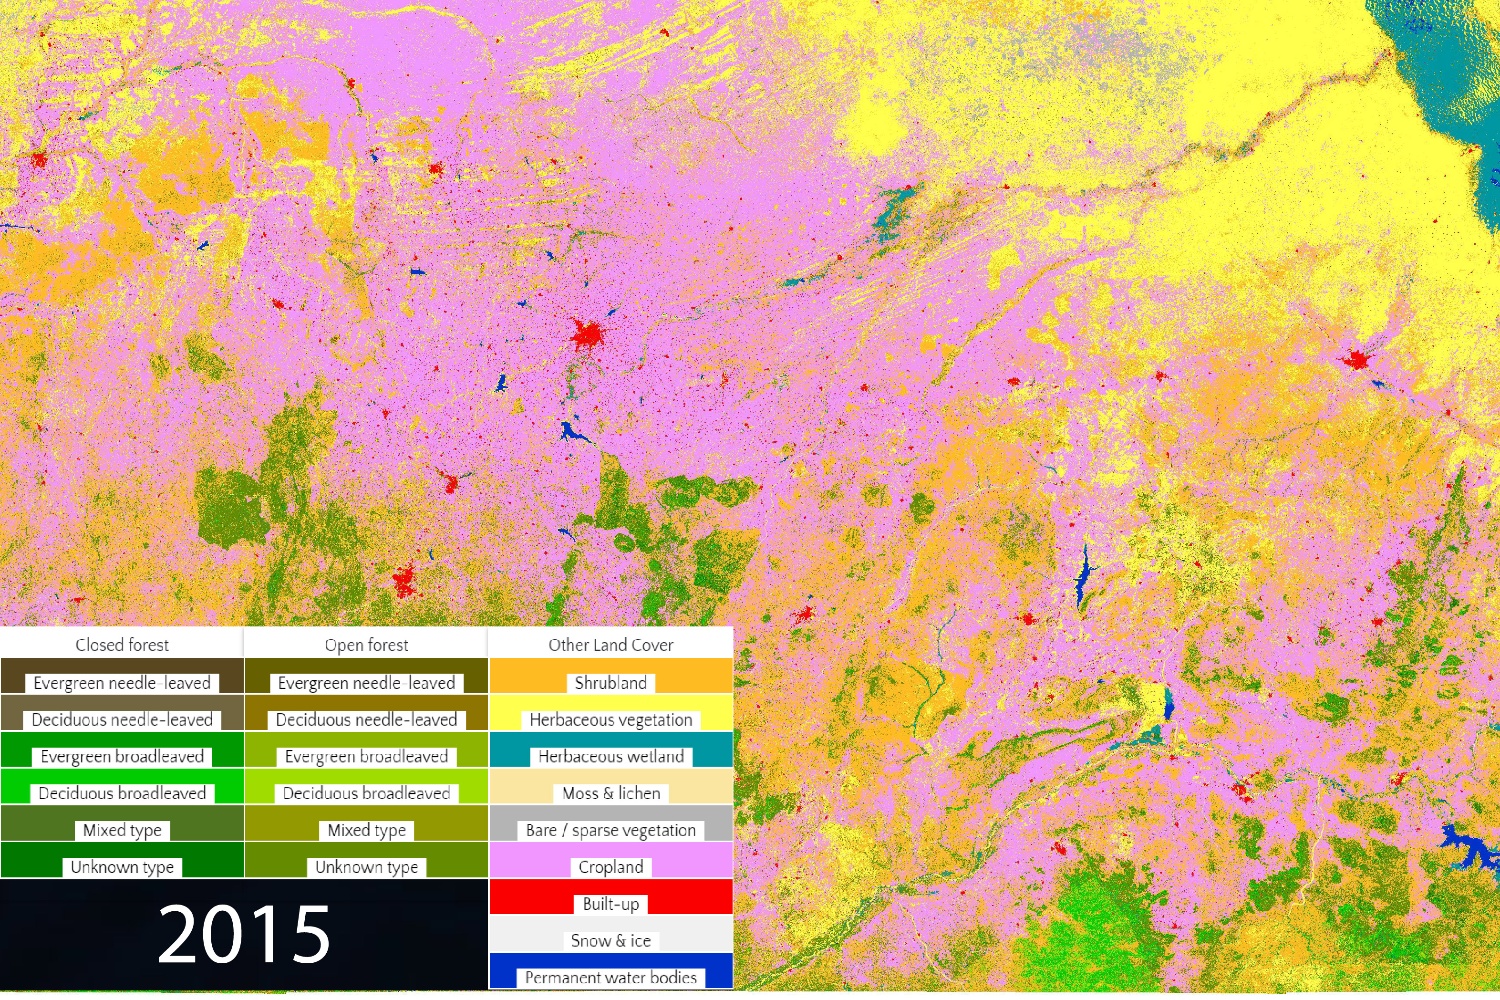
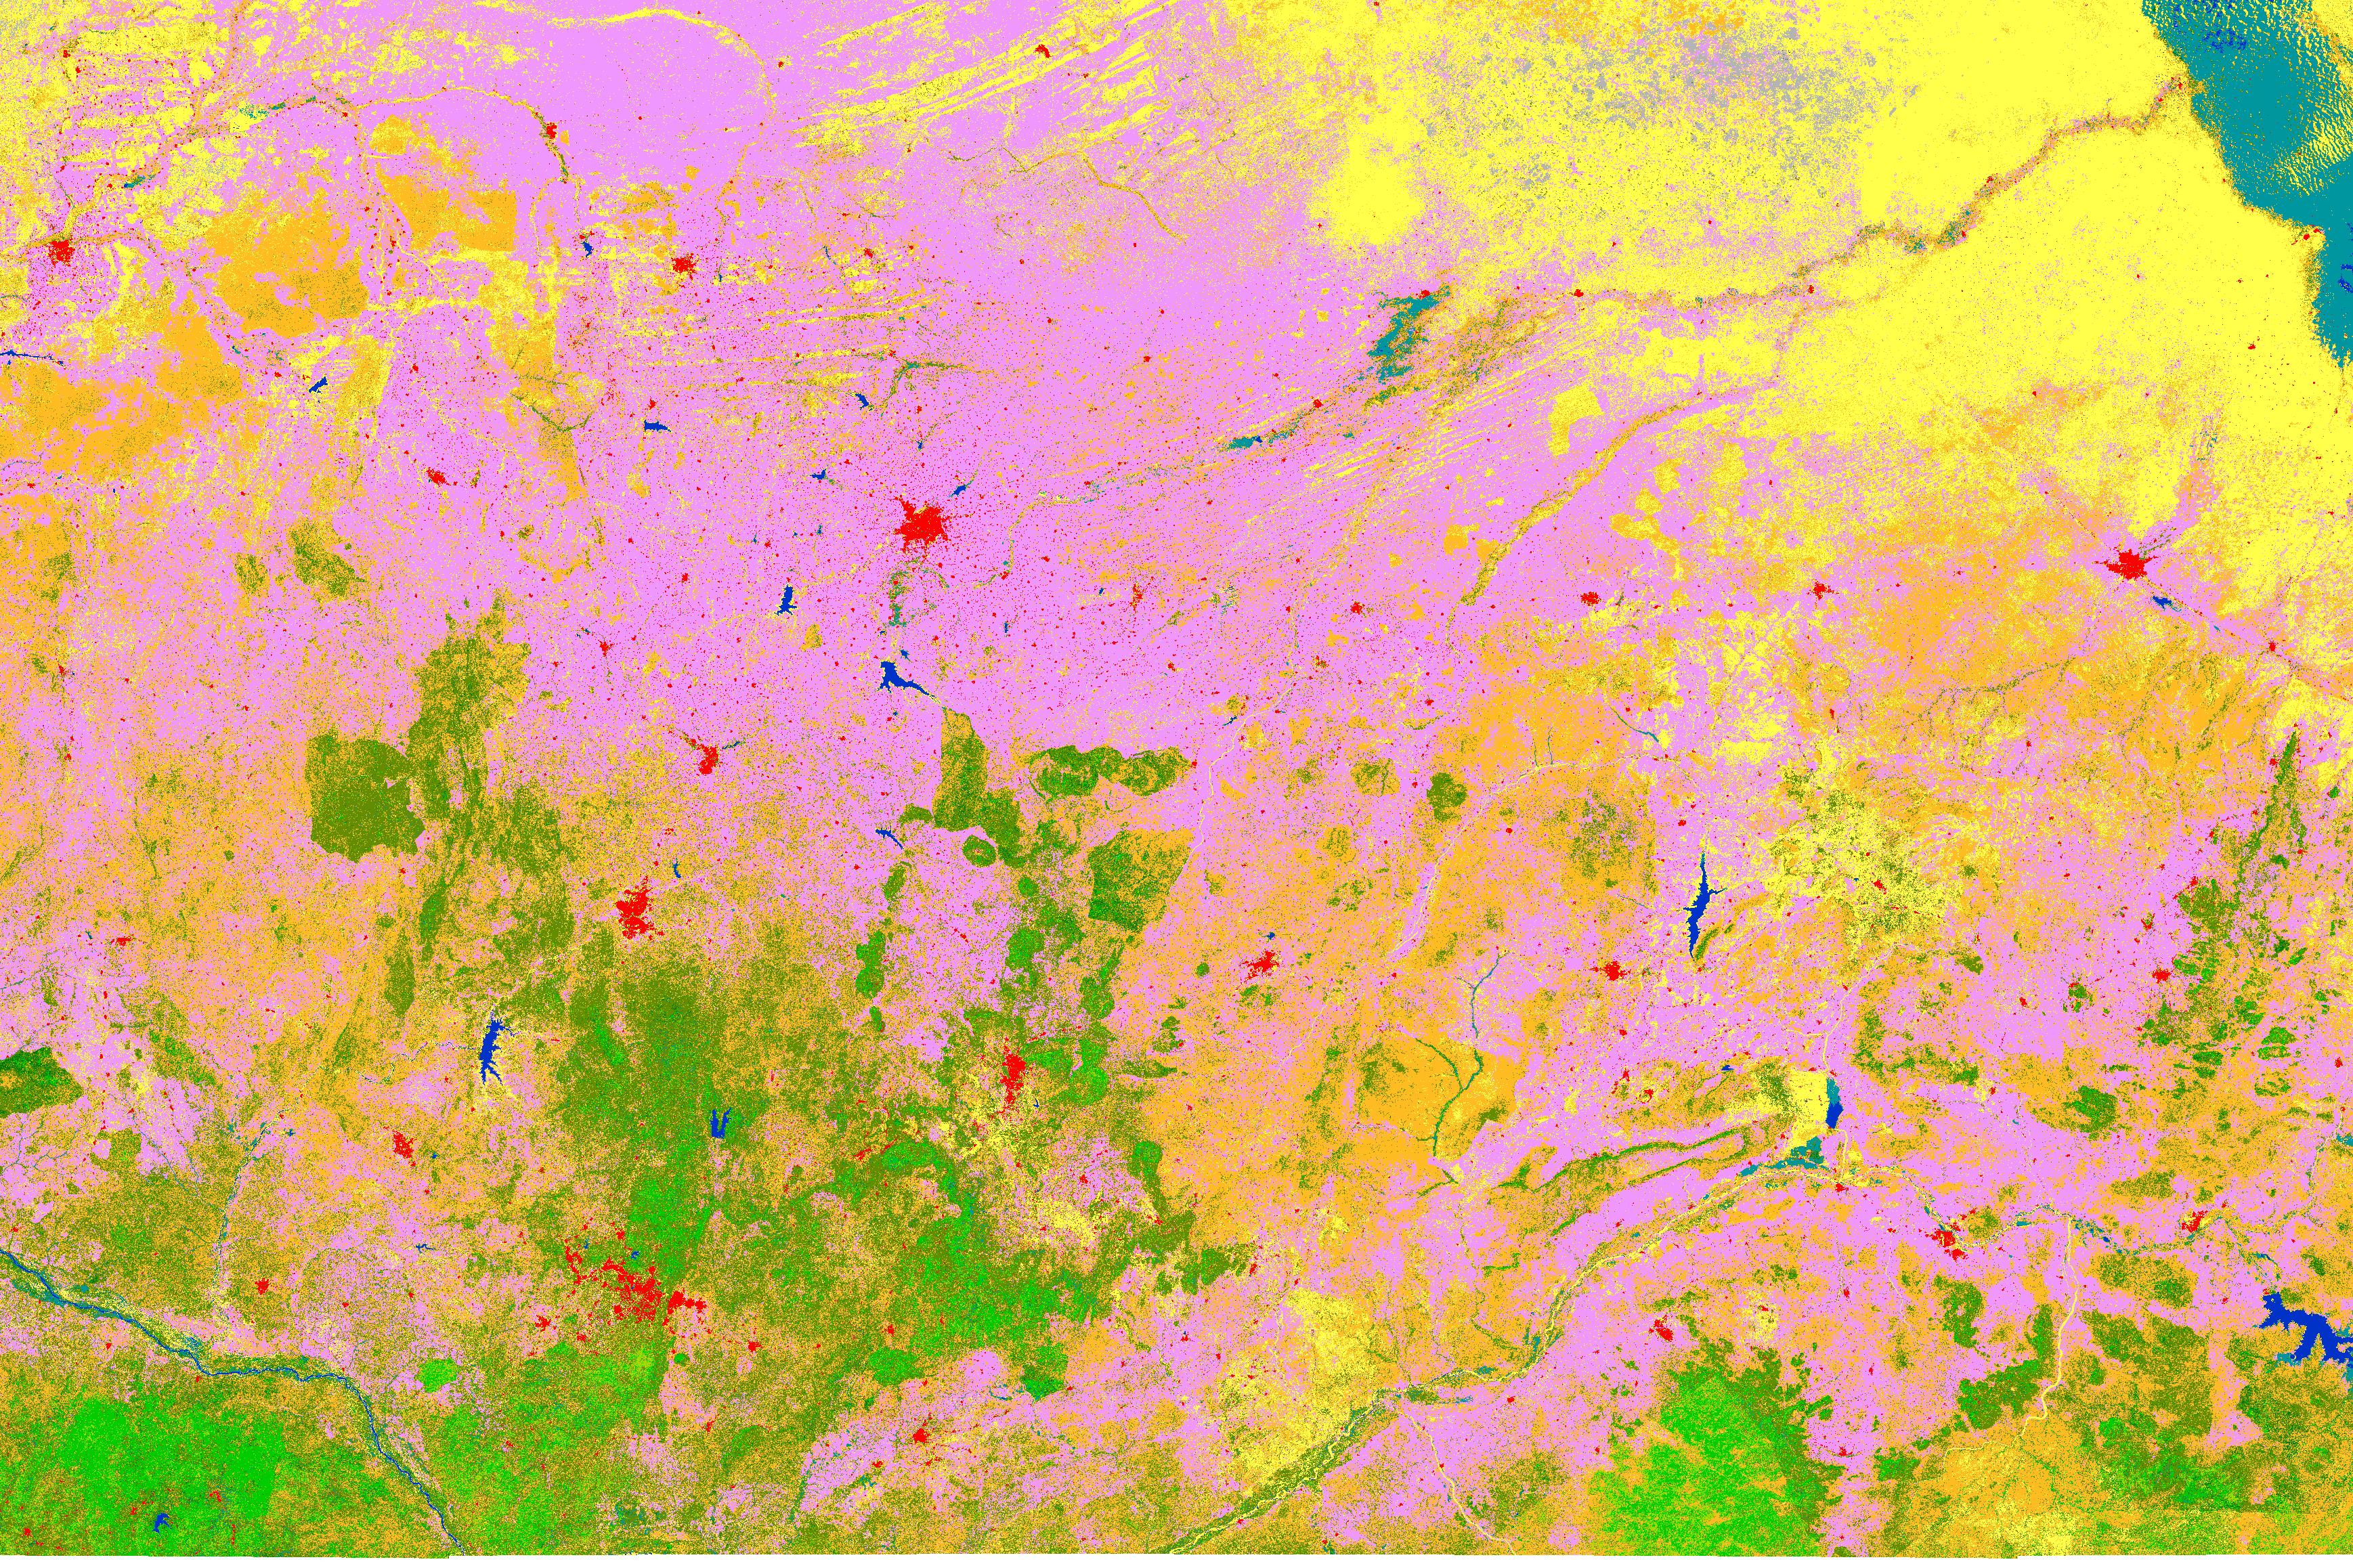
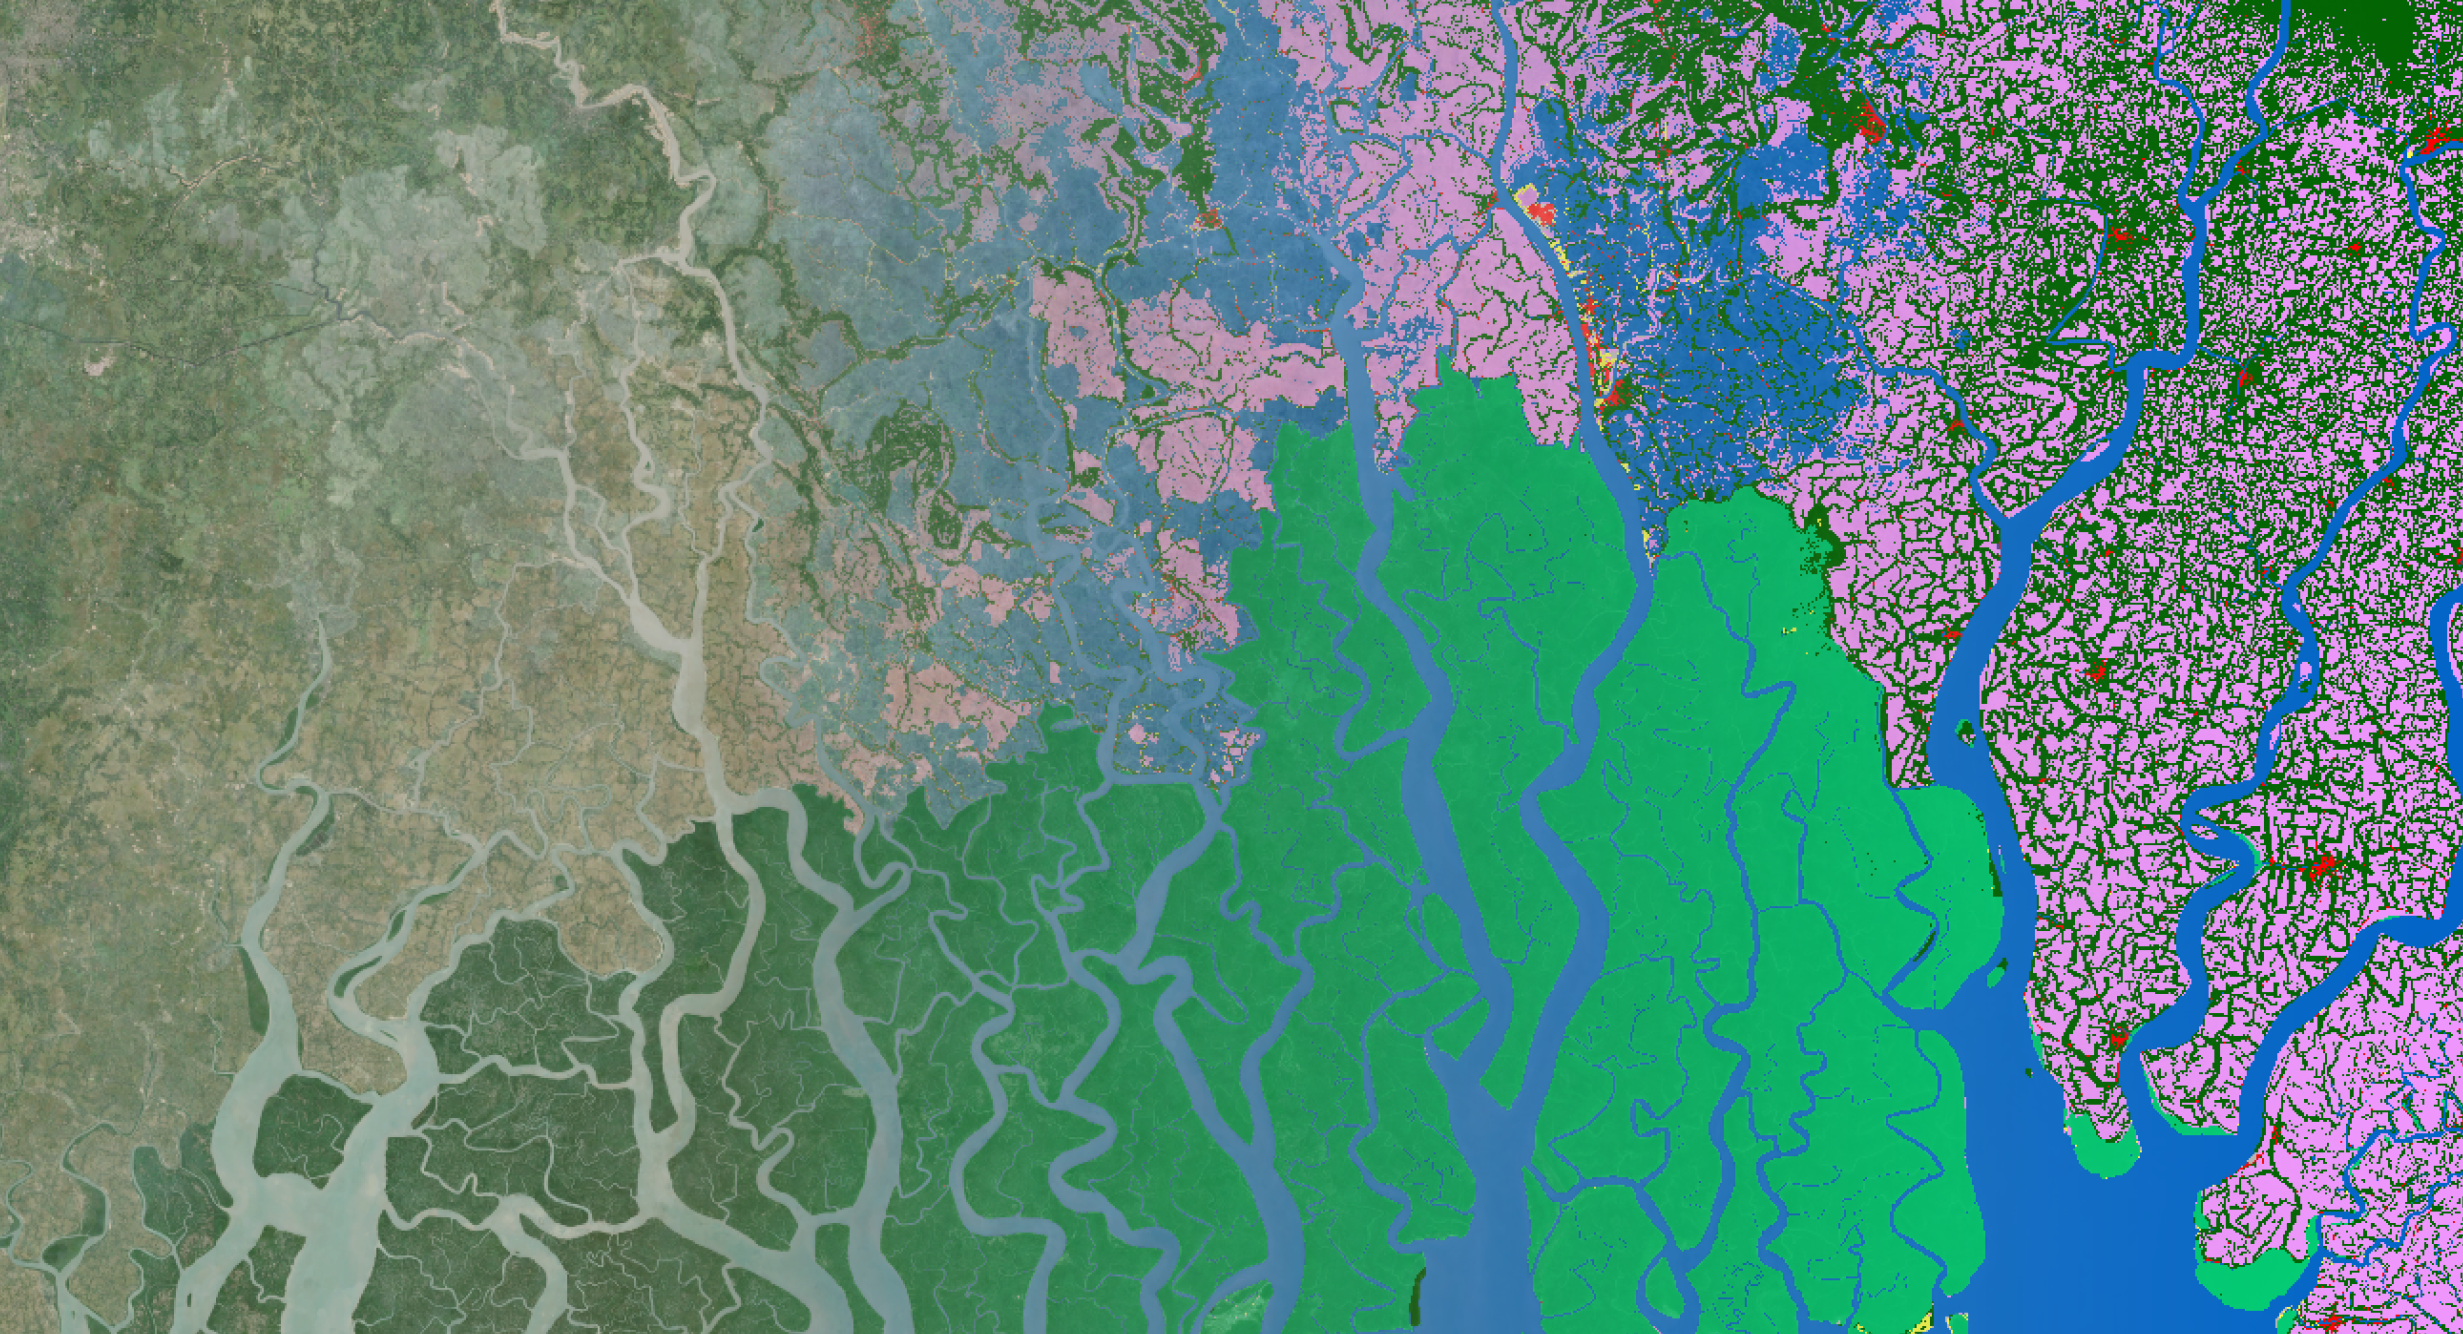
Discrete land cover classification at the Nigeria-Niger border for 2015.
Case studies over the Sahel
The Sahel is a region that has experienced substantial land cover changes over the last 30 years. One of the main anthropogenic influences over the Sahel is the expansion of cropland since the turn of the century. These human-induced changes are nicely captured in e.g. the resulting maps below.
Next to large expansions in cropland near the Nigeria-Niger border we also observe an intensification within existing agricultural areas. Near the cities in the north of Nigeria, in 2000, patches of grassland and shrubs were observed, whereas in 2015, these are almost completely converted to cropland.
Discrete land cover classification (upper) and crop cover fraction (bottom) at the Nigeria-Niger border for 2000 (left) and 2015 (right). Higher saturation indicates higher crop cover fractions.
Next to anthropogenic influences, the Sahel region experienced a long period of drought in the sixties and seventies. This lead to various claims of desertification of the Sahel. Recent research however showed a greening of these parts of the Sahel induced by increased precipitation numbers since the early nineties. The example below for Mali shows the expansion of herbaceous vegetation to the northern parts of the Sahel since 1988, confirming this greening. Apart from climatological influences related to increases in precipitation numbers, also grazing policies implemented by the local government may have contributed to the increase in herbaceous vegetation in the northern parts of the Sahel.
Discrete land cover classification (upper) and herbaceous vegetation cover fraction (bottom) in Mali for 1988 (left) and 2015 (right). Higher saturation of yellow indicates higher herbaceous vegetation cover fractions.
Next up? Annual land cover and fraction cover maps
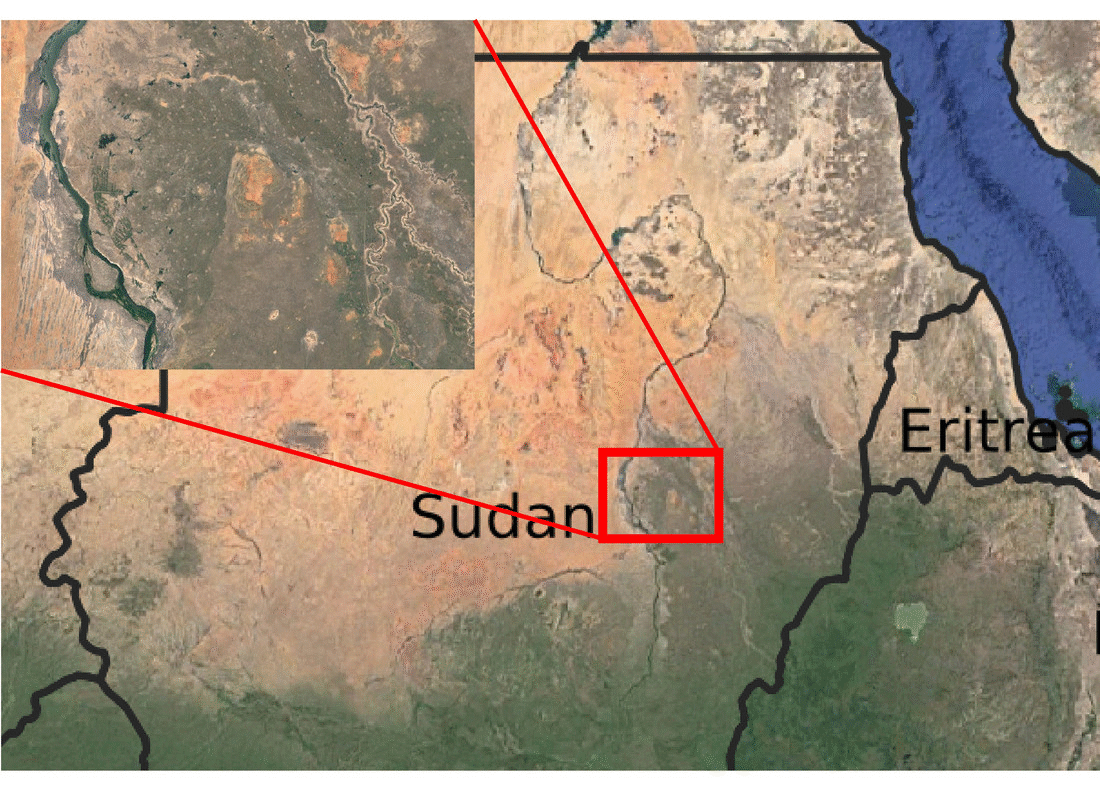
These two examples showcase the capability of our land cover workflow to detect changes in land cover. In the next phase, we will focus on providing annual historical maps for the entire Sahel region for the period 2010-2015 and five year intervals for periods before 2010. These will be used to identify ecosystem tipping points within the UTURN project. An example of these historical maps for Sudan is given below.
The resulting land cover and cover fraction maps will be published on Google Earth Engine and Zenodo by the end of summer, as well as a scientific paper presenting the methodology and full maps. But first we’re looking forward to the release of the Copernicus annual global land cover products at 100 m resolution for the period 2015-2020 to be published in a couple of weeks. Subscribe to our remote sensing newsletter and follow us on https://twitter.com/VITO_RS_ to stay informed.

/lewis-latham-0huRqQjz81A-unsplash.jpg)