Growing awareness to monitor and protect marine life
Before I explain you more, let me start with a question. Did you know that over 5 trillion pieces of plastic currently litter the ocean? 5 trillion! That’s huge. In order to counter this, the ‘Ocean Cleanup’ was recently launched, being the first and largest cleanup in history to remove garbage floating around in the Pacific Ocean.
The good thing is that more and more people and organisations are getting convinced marine life should be better monitored and protected. Of course, this is only possible if we keep an eye on the human influence on a specific ecosystem.
The dredging community e.g. takes measures to protect marine life and decrease the impact on our environment. Given the nature of dredging, it is inevitable these activities bring additional sediment particles in the water column.
Terrascope.be: Quick access to satellite data
To retrieve the latest data for the the Natura 2000 site Bay of Greifswald we accessed the online platform for satellite data and derived information ‘Terrascope’. Complete time series are available together with historic data.
Here’s a sequence of satellite images available in July and August 2018 for the Bay of Greifswald. The Terrascope web service contains a tool to filter out less useful images in terms of cloud cover. You can even set a threshold yourself for cloud masking.
From True Colour to Water Quality Assessment
Now that you have the right satellite data, you still need to retrieve quantitative information regarding water quality, preferably without a lot of time consuming image processing.
When it comes to processing ocean colour satellite data, we have developed quite some expertise resulting in a set of different algorithms and procedures for the remote assessment of water quality parameters such as:
- Turbidity
- Total Suspended Matter (TSM)
- Chlorophyll-a
- Attenuation coefficients
- Algae bloom detection
- Water body delineation
For each of these end products, a dedicated workflow is set up. A vital part within this flow is the atmospheric correction software iCOR, launched in 2017 to correct Sentinel-2 and Landsat 8 data.
For areas such as Bay of Greifswald the information from open satellite data is valuable to complement field measurements, and to better understand the natural and historic site conditions in terms of the above mentioned water quality parameters.
Dredging activities in the Bay of Greifswald, a CASE STUDY
To show you the potential of satellite data, I’ve selected two images to give you an example, i.e. one of 31/07/2018 and 07/08/2018. Land areas are masked in white. True colour images are provided as a reference.
On 31/07/2018, the true colour image already shows increased turbidity, mainly in the central part of the zone. This is also observable on the turbidity map represented by light green colours. The images also provide information on the size and origin of this turbidity plume, coming from the mouth of the river ‘Peenestrom’. The plume stretches about 12 km up North and is about 10 km wide. The presence of vessels can also be observed in the images. In the next section, a zoom is performed on some of these areas (marked by red rectangles).
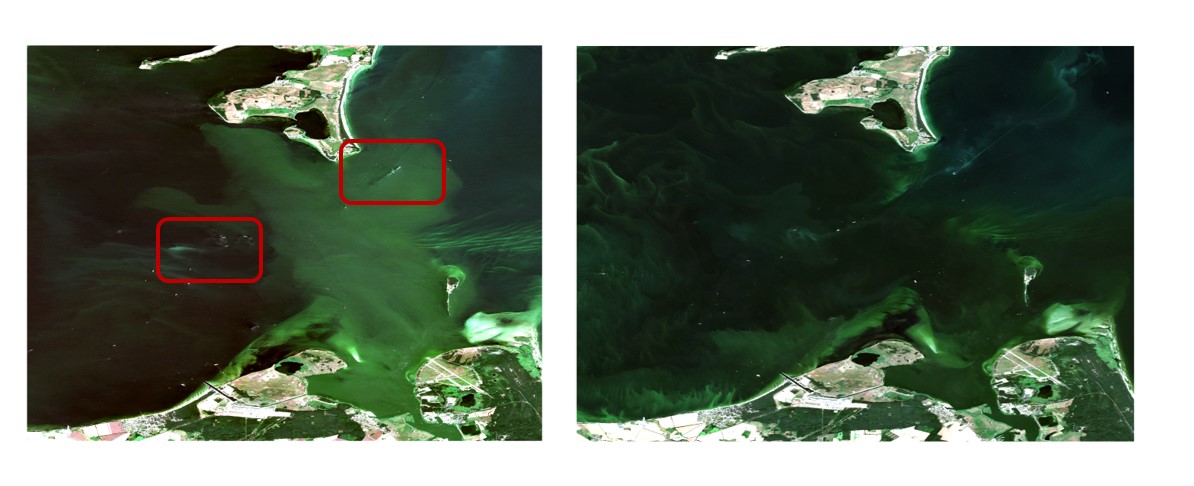
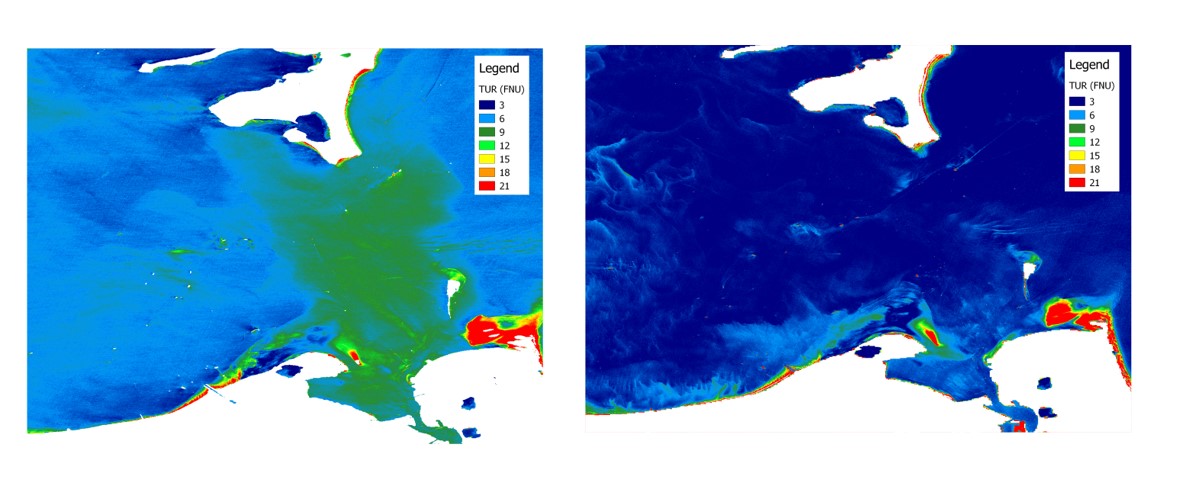 True colour image (above) and Turbidity Maps of the Bay of Greifswald acquired on 31/07/2018 (left) and 07/08/2018 (right). The red rectangles designate the zoomed areas shown below. The same colour scale is maintained for direct comparison of both images.
Satellite images cannot only characterize turbidity levels on a regional scale but also in the direct vicinity surrounding a dredging vessel. For example, variations are observed in turbidity levels in the slipstream of the vessel in figure 3. Although maximum values are exceeding 30 FNU, the total extent of the plume seems to remain limited. The figures below show lower turbidity values around other dredging vessels operating in the region (up to ± 15 FNU).
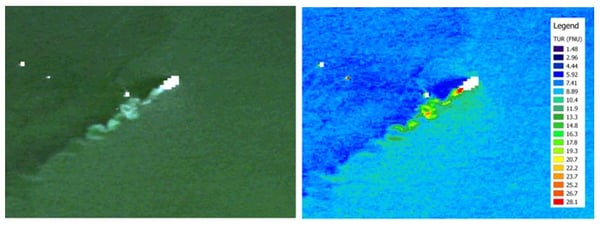
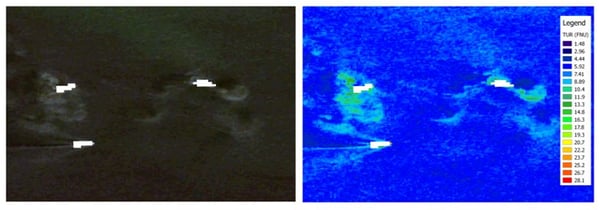
Zooms of the red rectangles of figure 1 above.
As mentioned earlier, other water quality parameters can be derived from ocean colour satellite imagery. As an example, the measured chlorophyll-a concentrations on 07/08/2018 are depicted in the figure below.
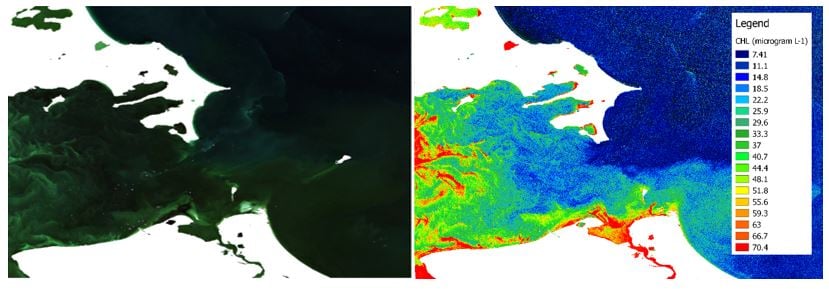
True colour image (lleft) of the Bay of Greifswald acquired on 07/08/2018.
The image at the right shows the transition to a chlorophyll-a end product.
Drones as a complementary tool to satellites
The main advantages of satellite images is to obtain a glimpse of a whole region at once. In addition, the Copernicus satellite data are open and free-of-charge. On the other side, ocean colour satellite imagery from a specific space-borne optical sensor is only available at certain fixed repetition frequencies. For example, Sentinel-2-MSI (Multispectral Instrument) provides a new image of a region approximately each 5 days.
To increase the number of observations, you can combine optical sensors from different satellites like Sentinel-3 OLCI (Ocean and Land Colour Instrument) or Landsat-8 OLI (Operational Land Imager), but recently we are also exploring the options of developing drone-based water quality products next to the satellite products. Drones have the advantage of being flexible in data acquisition and because they fly at limited altitude, cloud masking is not an issue.
For more information on drone-based monitoring for water quality I can also refer you to some of our previous stories shared, 'Drones to monitor water quality' and 'Monitoring water quality in your backyard'.
Stay tuned to spot new stories on latest news and updates regarding drone applications for water quality assessment.
/lewis-latham-0huRqQjz81A-unsplash.jpg)
/boudewijn-huysmans-_iyh6g5KHQA-unsplash.jpg)